Employing remote sensing and big 3D data to map infrastructure, identify risk, and build resilient cities
For several years, civil and environmental engineering assistant professor Dr. Jie Gong has concentrated his research on using remote sensing to gather geospatial big data and applying sophisticated data analytics to understand landscape changes in the context of natural disasters. Technology and methods emerging from this sort of research can support rapid response, debris removal, and recovery management.
An active presenter, researcher, and workshop host, Gong shares what he knows about how useful these tools are immediately after disaster strikes—and to build resilience before crises as well. His reputation as a leading expert in this field has rapidly grown.
Coastal cities are particularly vulnerable to severe weather. Over decades they have evolved into highly concentrated, complex infrastructure and building systems that are challenged by fluctuating demographics and literally shifting environments. Research to make them more resilient, sustainable, productive, and equitable is critically important.
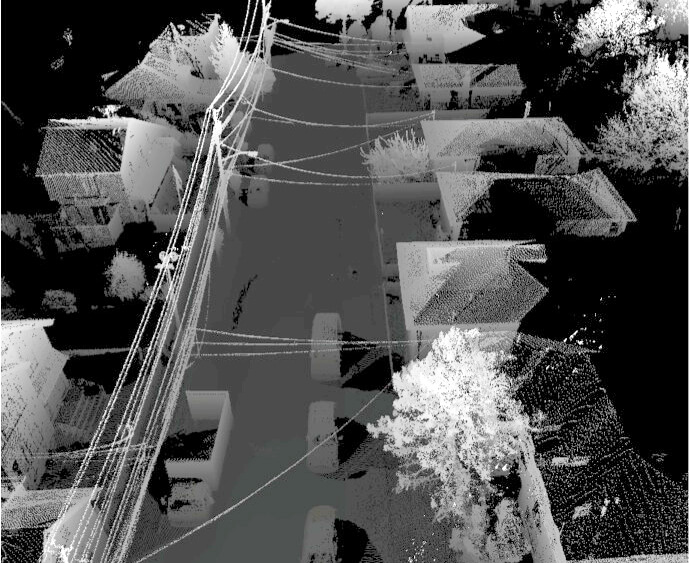
After Superstorm Sandy, CAIT funded a seed project for Gong and a team of grad students and professionals from Woolpert, Inc., to collect high-res, ground-based lidar data from some of the hardest hit communities in New Jersey and New York. He received significant attention for the research, including a distinguished engineering award from the New Jersey Alliance for Action.
Changes to roads, buildings, and terrain that are caused by hurricanes like Sandy, landslides, and earthquakes, can lead to pipeline leaks, joint-weakening, or even ruptures. Pipeline owners/operators need to know what may be damaged and be able to identify pipeline sections that are at highest risk so they can prioritize repair and restoration efforts in these situations.
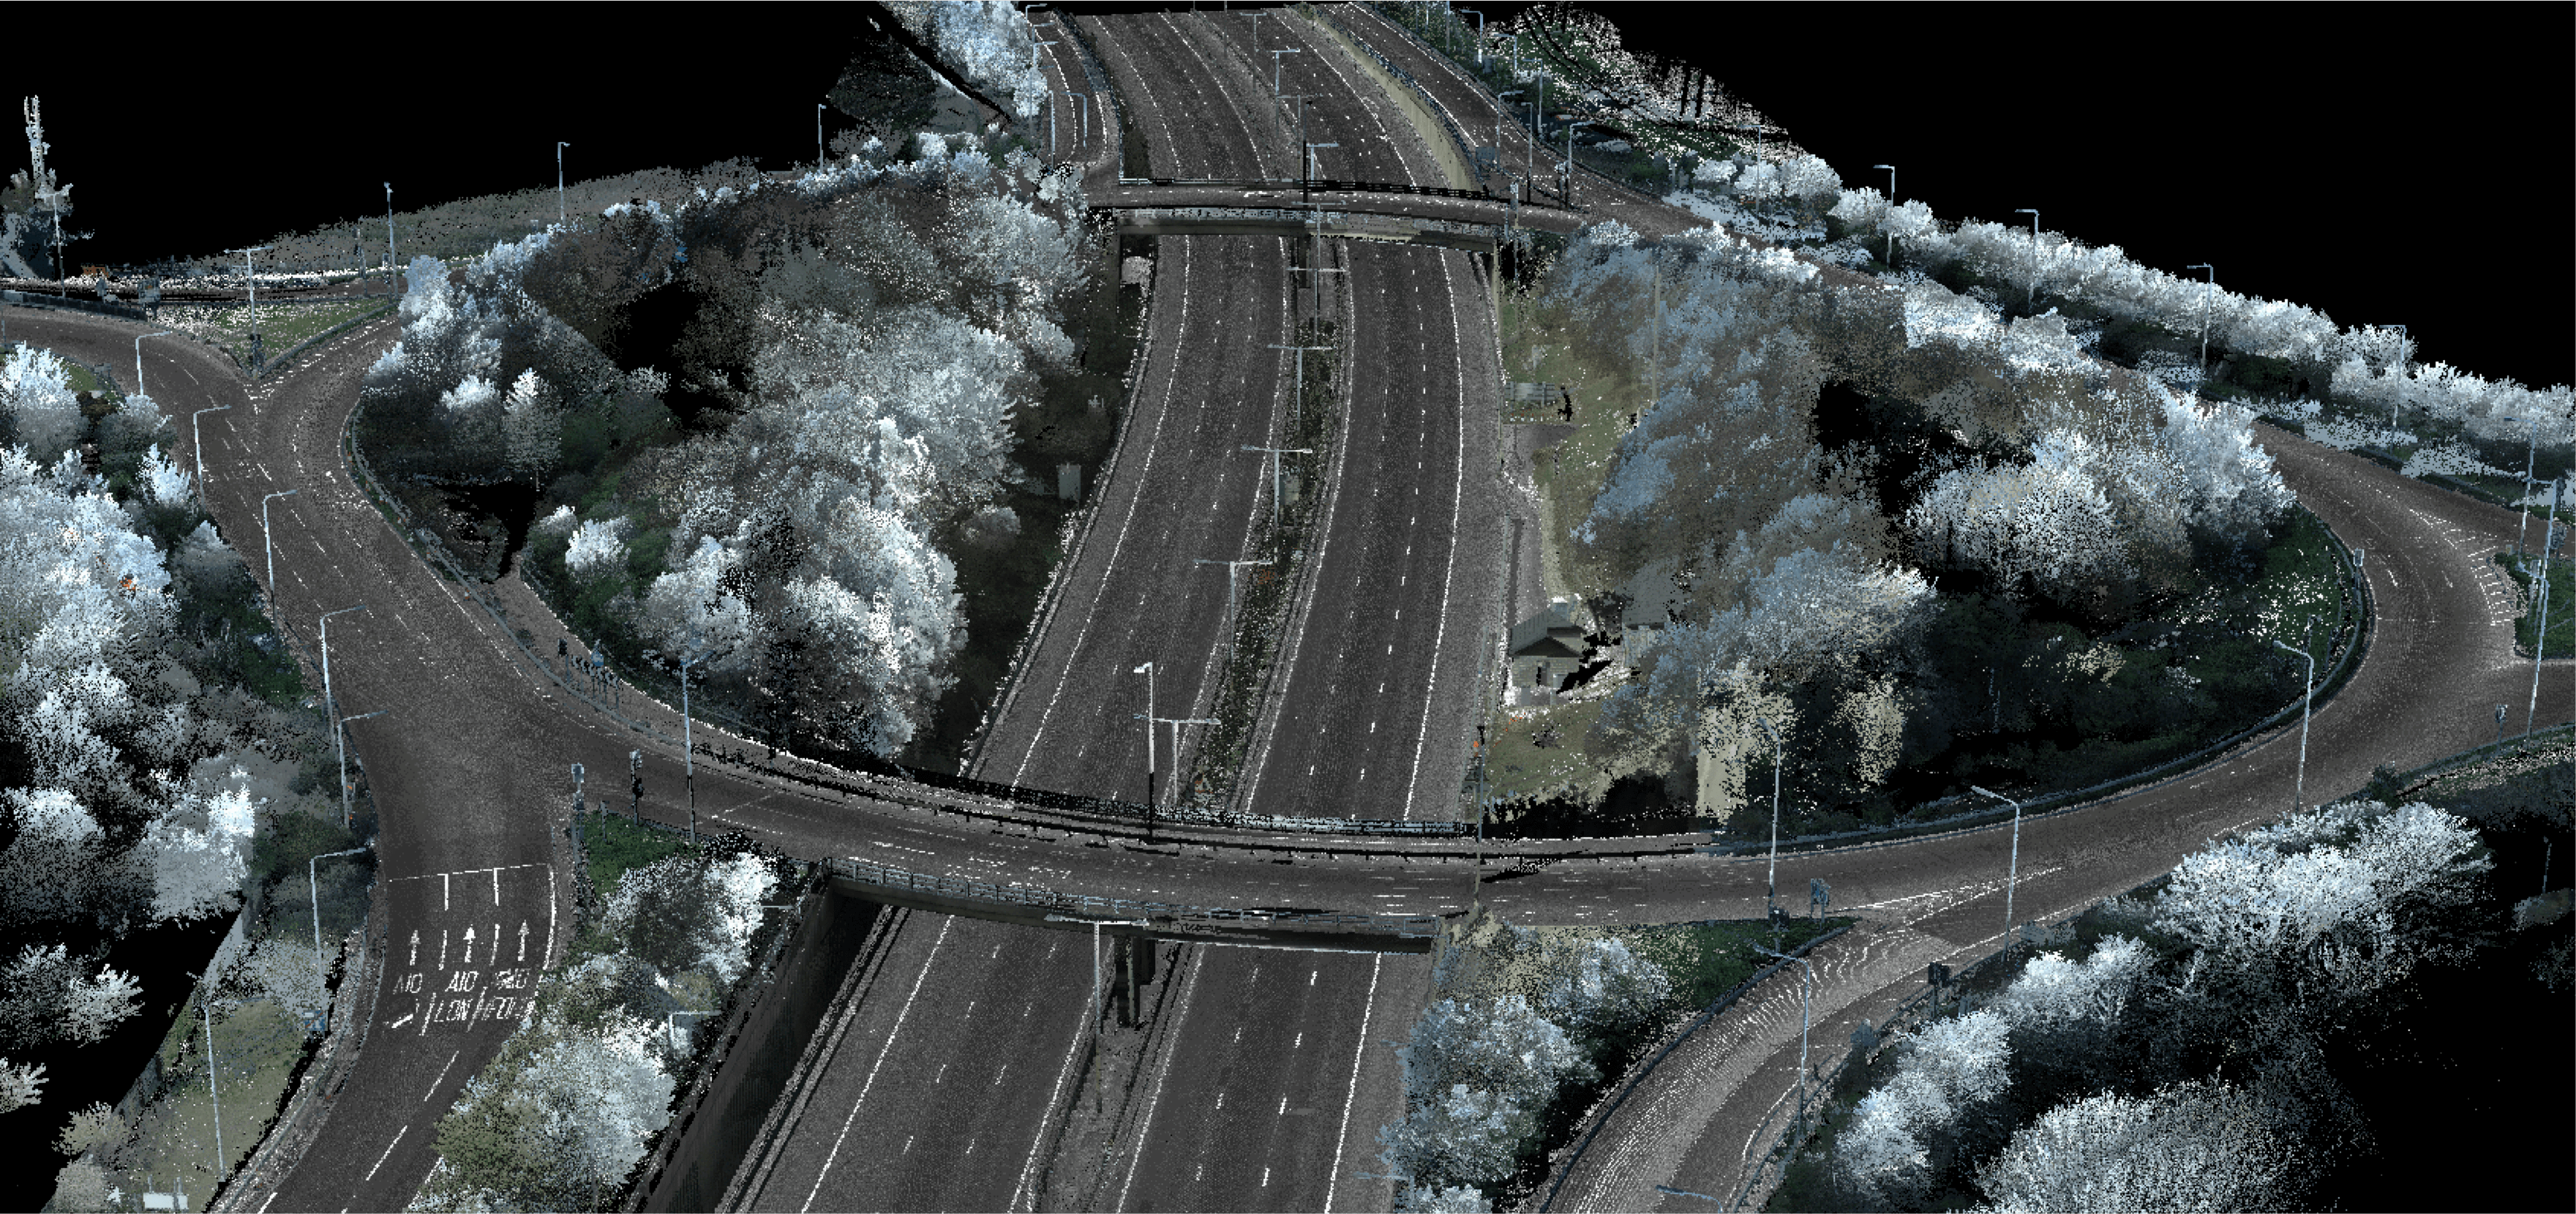
To address this need, Gong developed a mapping, monitoring, and risk assessment system. It combines mobile mapping and remote sensing technologies; a point cloud and infrared imagery analysis system that semi-automates detection of changes and anomalies in the built environment; and GIS-based pipeline risk assessment tools.
The beauty of what he has developed is it can be applied to virtually any infrastructure system.
For the past two years, Gong has been invited to speak at Bentley’s Year in Infrastructure event, a global gathering that explores the intersection of technology and business drivers, and what current and emerging processes, products, and practices are shaping the future of infrastructure.
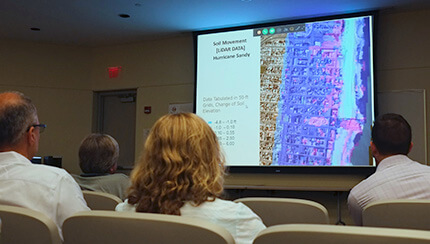
At the 2016 Bentley conference Gong gave a presentation, “Building Resilient Cities with Big 3D Data.” Expanding on his Sandy and pipeline risk research and ongoing projects, he gave an overview of processing, analysis, and sharing of city-scale 3D geospatial data and how big data can be applied to critical infrastructure systems for damage and vulnerability assessment, risk analysis, modeling, and visualization.
A few months before his Bentley appearance, as Gong’s Pipeline Sensing and Monitoring Project was wrapping up, he and senior research engineer Andrés Roda, hosted a one-day workshop on remote sensing and its role in meeting future technological and regulatory needs when building and maintaining resilient natural gas pipelines. The workshop drew attendees from PSEG, NJ Natural Gas, ConEdsion, New York State Electric and Gas, and other utilities; government agencies including PHMSA, and NJ Board of Public Utilities; and private engineering/contracting.
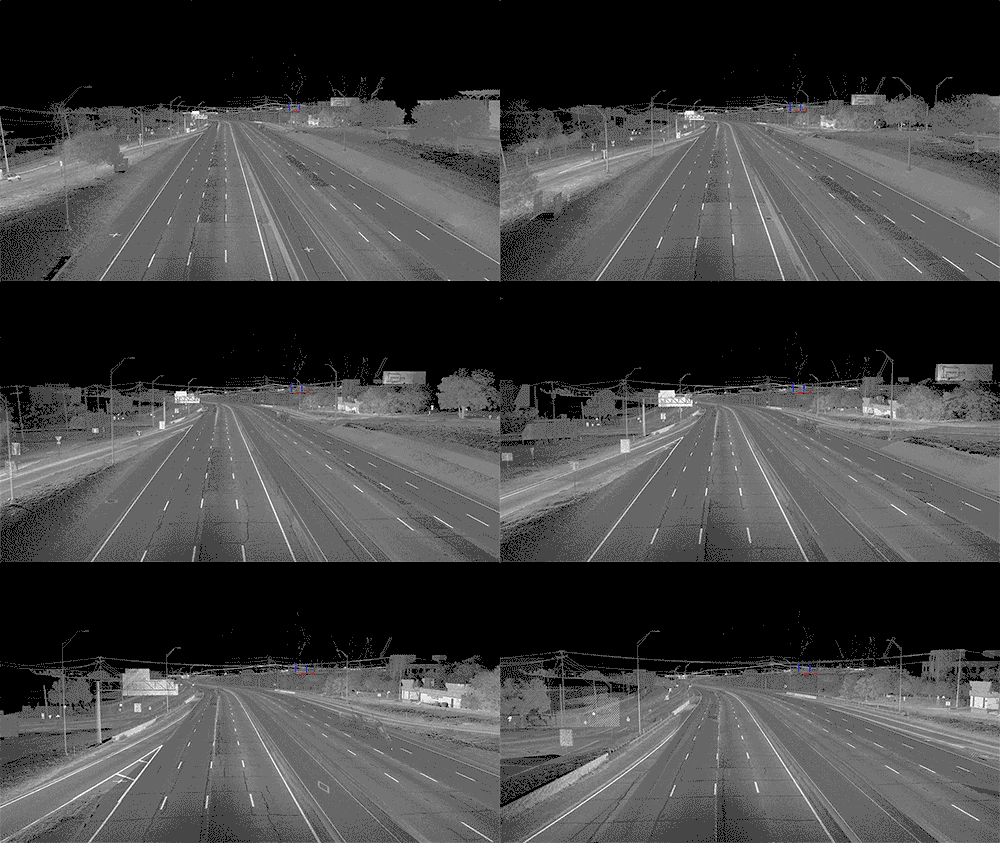
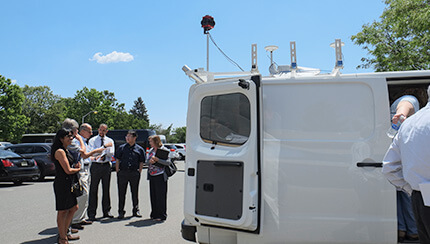
Gong told the group about his research, and he and Roda showed them the “hardware” platform developed specifically for the pipeline project—lidar, infrared sensing, GIS, and conventional digital imaging—that is integrated on a vehicle. This set up lets Gong’s team move at traffic speeds gathering high-resolution data about the landscape surrounding natural gas pipelines. The “software” then processes spatial data from a variety of sources to extract threat indicators and integrate them with the risk analysis program.
Says Gong, “It starts with data collection and ends with actionable information for decision makers. The ultimate goal is a complete solution that can be readily put into action.”
More Info
- >> Watch PBS Video on Gong’s Hurricane Sandy project
- >> Pipeline Sensing and Monitoring Project research description and report
May 2017

