In the years following the devastation that Hurricane Maria caused for Puerto Rico, CAIT-affiliated researchers at PUPR have been collecting field data from damaged traffic signs and bridges, testing these transportation assets to better understand their structural failures and breaking points during the storm, and now are making recommendations based on these findings that can help strengthen the resilience of the island’s overall transportation system.
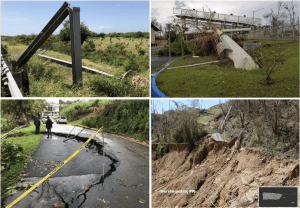
Just a few examples of the destruction to transportation infrastructure caused by Hurricane Maria. Photo ©Dr. Gustavo Pacheco-Crosetti.
Almost everything in Puerto Rico was affected by Hurricane Maria, said Dr. Gustavo Pacheco-Crosetti, a CAIT-affiliated researcher and Director of the Transportation Infrastructure Research Center at the Polytechnic University of Puerto Rico (PUPR).
He and his team have been studying damages from the storm to all types of infrastructure on the island — from buildings and homes to vehicular bridges and traffic signs — in order to better understand the storm and help Puerto Rico rebuild with more resilience in the future.
When the Category 4 storm struck in 2017 it devastated the island, leaving nearly $100 billion in damages, approximately half a million houses damaged or destroyed, cutting off electricity to the island, collapsing critical bridges, uprooting transportation signs and other infrastructure, and much more.
“The storm affected nearly every town in Puerto Rico due to high wind speeds, flooding, and landslides, and caused erosion across the coasts as well,” Dr. Pacheco-Crosetti said.
Following the storm, PUPR in partnership with the Rutgers Center for Advanced Infrastructure and Transportation (CAIT) University Transportation Center (UTC) program, has been examining the damage to specific key pieces of transportation infrastructure in order to better understand the structural failures and help provide informed guidance for rebuilding with greater resilience.
Specifically, researchers have been looking at three areas: traffic signs, pedestrian bridges, and vehicular bridges to better understand how they reacted to the storm. But, Dr. Pacheco-Crosetti said that the original motivation for the project had to do with better understanding the wind speeds reported during the hurricane.
“For a Category 4 Hurricane, like Maria was, you would expect wind gust speeds between approximately 157-191 MPH,” he explained. “What we saw being reported following Hurricane Maria was that wind speeds in certain areas were estimated at approximately 140 MPH. With that in mind, we saw an opportunity to study damages done to traffic signs that could in turn give us a better understanding of the actual wind gust speeds.”
He added that accurate wind-gust estimation is important for better understanding the storm, but also to provide usable data for future wind design updates that can strengthen infrastructure resilience in areas such as Puerto Rico, that are often exposed to storms and high wind speeds.
So, the team set out to analyze transportation signs across the island that had failed in order to develop an inventory of structural failures among traffic signs in Puerto Rico, establish key case studies that could be analyzed to better estimate wind gust speeds that would have triggered their specific failures, and finally make recommendations based on the findings.
After locating the signs, the team identified three main modes of failures in I-beam mounted traffic guide signs: foundation failure, which was a result of overturning; fuse and base plate slippage failure, which was a result of failure in the breakaway systems of some of the signs; and fuse plate fracture, which also dealt with the sign breakaway systems.
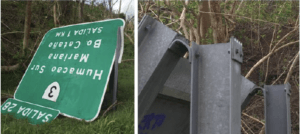
Images of damaged sign from Case 1. Photo ©Dr. Gustavo Pacheco-Crosetti.
From this, they selected three case studies and gathered specimens to test in their lab in order to learn at what stress point the different infrastructure types would fail.
“Statically, you can obtain the wind pressure required to produce failure once you understand the pressure that specific infrastructure responds to,” Dr. Pacheco-Crosetti said.
He said that the eventual results found that Cases 1 and 2 failed at wind gust speeds in the range of 177 – 196 MPH, which is consistent with the maximum wind gust speeds expected for this type of storm and it is reasonable to conclude that these signs failed near the maximum wind gust speeds that occurred during Hurricane Maria.
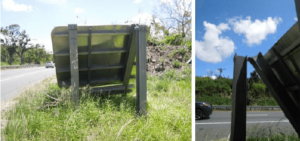
Images from damaged signs in Case 2. Photo ©Dr. Gustavo Pacheco-Crosetti.
Case 3 failed at 116 MPH, which was lower than the wind gust speed expected. He said it is reasonable to conclude that this sign failed at speeds lower than maximum that should have occurred in the area.
This is the type of valuable resilience information that engineers and agencies can use to make asset management decisions in areas subject to storms that consider resilience, Dr. Pacheco-Crosetti said. For example, he shared some recommendations as a result of these study findings.
“First, we found that additional exit signs on top of primary highway signs had a significant effect in reducing the wind gust speeds required to produce failure,” he said. “For example, in Case 1 there was approximately a 14% reduction in wind speed and a 30% reduction in wind pressure needed to cause the failure.”
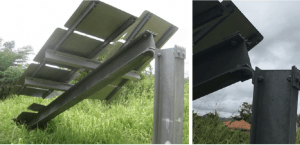
Images of damaged signs from Case 3. Photo ©Dr. Gustavo Pacheco-Crosetti.
This leads to new potential areas of research, he said. Wind tunnel analysis should be performed in order to generate more accurate data. But also, alternatives to the common practice of placing exit signs on top of primary signs should be studied such as including exit information in the primary sign, as this could be a potential solution for areas exposed to high wind speeds such as Puerto Rico.
Other recommendations from these three case studies and analysis of wind speeds were to avoid having too many signs on a single post. Dr. Pacheco-Crosetti said that Case 3 had 11 signs on one post which contributed to its failure during the hurricane.
And, back to Case 1, the research team also found that had the plastic hinge on the sign been placed just 10 inches higher, wind speed needed to cause failure would have increased by approximately 7% without impacting the sign’s breakaway system.
“These are all important pieces of information that help us better understand the story of Hurricane Maria as well as the changing transportation infrastructure and resilience needs within our region,” Dr. Pacheco-Crosetti said. “We believe this data can help us build back stronger going forward.”
Researchers at PUPR also looked at a number of other pieces of infrastructure during their research.
More Traffic Signs
The three types of traffic-sign supporting structures analyzed that failed during the storm included steel truss cantilever guide signs anchored to a concrete pedestal, guide signs supported by I-sections with break-away systems (the cases mentioned earlier), and small regulatory signs supported by a single square or U-channel post.
As mentioned, the team looked at a variety of different failure types, that were then documented and geo-located. Smaller regulatory signs on U-channel posts, for example, were found to have had experienced large-dynamic responses such as fluttering due to the wind speeds.
Researchers recommended further studies to understand the response of these signs to wind flow, as well as replacing the failed or damaged U-channel posts due to Hurricane Maria with square posts, as they seemed to perform well.
Pedestrian Bridges
For pedestrian bridges the team worked to develop an inventory of these systems that experienced damages or collapsed due to the storm and document the type of failures experienced.
They studied 32 bridges primarily within the San Juan Metropolitan Area, and found that overall, most performed well during the storm. That said, those that did show signs of damage often had traffic signs or other flexible elements attached to them.
As a result, Dr. Pacheco-Crosetti said that it is recommended to pay special attention in the future to where signs on pedestrian bridges are placed, to ensure that structures are reinforced to adequately support additional loads, and that after an extreme event preliminary inspection should not only contemplate the main bridge structure but any elements attached to it such as handrails or signs.
Vehicular Bridges
For vehicular bridges, the team found approximately 40 that had been closed following the storm, 18 that had collapsed, and 19 where the foundation had become exposed.
For this research, the team set out to generate a collection of documented findings by diverse sources such as official reports, news coverage, and social media, of the collapsed bridges due to Hurricane Maria. This was done with the intended goal of creating a common access repository of information about collapsed or damaged bridges in the area.
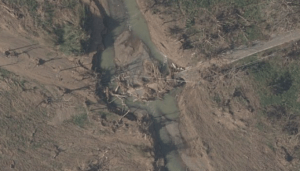
Vehicular bridge after Hurricane Maria. Photo ©NOAA
Currently the team has 18 comprehensively documented bridges and has collected more than 500 related multimedia documents.
So far, they have found that the principal cause of damage among these types of bridges was souring of the abutments, and hydrodynamic pressure. Additionally, several of the bridges damaged were replaced by temporary bridges.
For future permanent bridges, researchers recommended reviewing required span and abutment locations to reduce souring, reviewing required elevation to reduce hydrodynamic impact, and using crowdsourcing and social media data after future storms to help with gathering valuable graphical information to assess damages.