Online tool consolidates bridge databases to provide a clear, comprehensive picture of bridge health
Bridge owners are faced with difficult decisions every day; they rely on multiple resources to help them identify priorities for proactive maintenance and necessary rehabilitation. There are enormously useful databases out there—for example, the National Bridge Inventory—but no single source to find comprehensive bridge performance data. Until now.
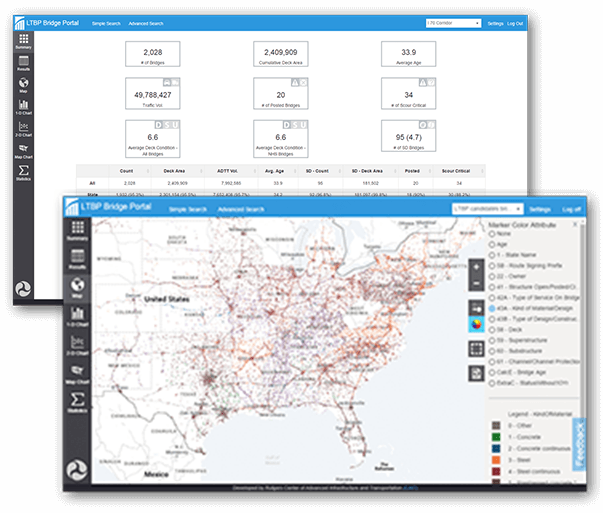
The LTBP Bridge Portal makes those very difficult decisions just a bit easier by aggregating all the data sets bridge owners would previously have to reference individually. But far beyond just providing data, the portal puts a number of analytical tools at users’ fingertips to make and support critical decisions about where limited funds are spent to preserve and repair bridges.
The LTBP Bridge Portal is the only one-stop resource that consolidates 34 years of historical data on all the characteristics and relevant biographical information influencing bridge performance—design, age, dimensions, elevation, weather data, traffic data, weigh-in-motion data, maintenance/repair records, and more—for over 611,000 U.S. bridges.
The portal was created at CAIT in partnership with FHWA’s Long-Term Bridge Performance (LTBP) program. Viewed as a model UTC-FHWA collaboration, the LTBP Bridge Portal was featured in the USDOT Spotlight in June 2016, but many functions and data have been added since then.
Powerful tool, simple interface
The LTBP Bridge Portal is powerful, highly customizable, and offers options not available in any one dataset it draws from. Its intuitive web environment is so simple that laypeople can use it, and if you’re new to the app or need to review the features, a built-in guided tour will show you what is available and how to make use of it.
The LTBP Bridge Portal can do simple or advanced queries using built-in filters, or detailed searches by specified criteria. No matter how complex, it delivers tailored results at lightning speed, usually less than 1 second.
An example query could be: How many bridges in Virginia, Maryland, and Delaware are at least 100 feet long, 30 years old or older, and have average daily traffic volumes greater than 10,000 vehicles. How many of those received a “poor” condition rating on at least 30 percent of the deck upon last inspection? How many are steel girder construction versus box girder? What is the inspection history for each bridge on I-95 in those three states?
Even if you know where to look, sifting through multiple databases to extract all that information could take hours. Comparing and contrasting bridge attributes and locations, analyzing individual bridges, or seeing patterns within the results would be arduous.
Results you can see: Data visualization options and deterioration models
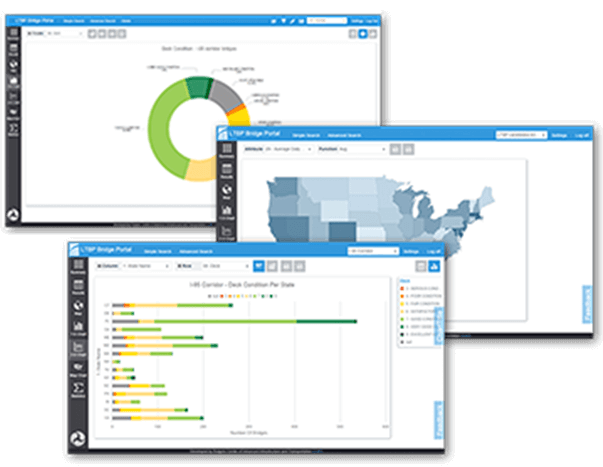
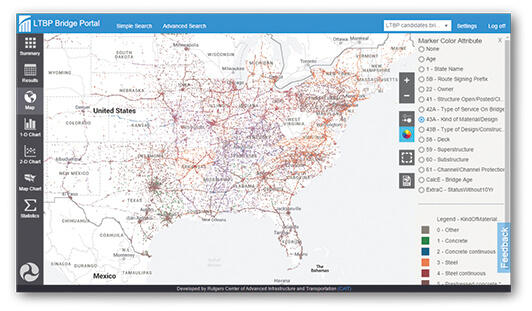
The bridge portal’s deceptively simple user interface and data visualization capabilities really outshine any other bridge performance tool available. Data results can be displayed in 1-D or 2-D charts and graphs, as map graphs, or in a GIS interface that superimposes the data on Google Maps®. Results then can be exported as Excel, PDF, or KML (Google Earth) files.
Examine results on a macro level to identify patterns and trends, or hone in on a specific bridge; even zoom in to street views and photos of the bridge when they’re available. Your queries also can be saved to access, edit, and review later.
In the past months, developers added a function to calculate deterioration models that are formulated from a wide range of historical data, and produced using multiple methods, including Weibull and Markov.
Packing a load of functionality into a single tool, while keeping it simple and fast was no small feat, and considering CAIT project manager Hooman Parvardeh built the tool using student workers exclusively makes it doubly impressive.
Parvardeh is in the process of spreading the word about this resource. “We’ve held webinars for more than 10 states and presented at a number of conferences including the last AASHTO Subcommittee on Bridges and Structures meeting,” he says. “I’m confident we delivered a product that was beyond FHWA’s initial expectations and the feedback from state DOTs has been tremendously positive.”
CAIT and FHWA plan for the LTBP Bridge Portal to continually evolve over time. Future enhancements include apps for Apple iOS and Android, life-cycle cost modeling, and performance comparison functions.
LTBP PORTAL PROJECT CONTRIBUTORS
Rutgers CAIT
Ali Maher, PI
Hooman Parvardeh, CAIT LTBP Program Manager
Ayush Jain, Lead Developer
FHWA Turner-Fairbank Highway Research Center
Hamid Ghasemi, LTBP Program Leader
Robert Zobel, LTBP Program Coordinator
Datasets included in the Portal
The LTBP Bridge Portal currently includes these major datasets, which are updated and expanded regularly.
- National Bridge Inventory (NBI) historical data from 1992 to 2016; updated annually.
- National Bridge Element (NBE) data for some states. (Starting in 2015, most states will submit NBE data to FHWA and it will subsequently be added to the portal.)
- LTBP Program inspection and field data. This typically includes data from nondestructive evaluation (NDE) testing, visual inspections, load ratings, and material sampling. This dataset will grow as the program progresses.
- NOAA weather station data. Shows number of freeze-thaw cycles and number of snowfalls for bridges within a certain radius of weather stations.
- LTBP legacy data mining. This comprises a wealth of information including data extracted from bridge plans, inspection and maintenance reports, and construction and preservation cost records.
Read an expanded article on this topic in the Fall 2017 issue of Transportation Today.
July 2017


