In this Issue:
NJTR-1 Training
Meet the Instructor: Lloyd Jacobs
Policies for Safe Road-Sharing
May is Motorcycle Awareness Month
Working Smarter, Together
Stakeholder Partnering Supported by Every Day Counts
EDC-4: Pavement Preservation
Infrastructure Improvements: NJ Transit Planning Hudson-Bergen Light Rail Expansion
Roadway Safety Spotlight: Longitudinal Rumble Strips and Stripes
Technical Assistance Now Available for Data Business Planning to Support State, Tribal, and Local Safety Data Integration!
New Jersey “Build a Better Mousetrap” Competition Open
Data-Driven Safety Analysis: A Health Check Up on Your Roadways
Did You Know? Work Zone Safety Facts
Learning About OSHA’s New Silica Standards
NJTR-1 Training for the “New” Crash Form
In January of 2017, the New Jersey Statewide Traffic Records Coordinating Committee (STRCC) released the new NJTR-1 Crash Record Form. The form contains several improvements, including additional data fields, from the existing NJTR-1 that was last updated in 2006. 11 NJTR-1 Crash Record Refresher training classes are available for law enforcement around the state.

Photo: Shutterstock.com
The training, sponsored by the New Jersey Division of Highway Traffic Safety, is designed to increase the proficiency by which officers complete the crash record form for the purpose of enhancing crash data that many end-users rely upon to improve traffic safety. Several videos have been added to enhance the training with visual examples from real crashes. In addition, the training team is providing additional learning materials to the officers, which include the new NJTR-1 form with all of the added fields highlighted, coupled with laminated overlays. The supplemental material will assist officers in properly completing this important source of data.
There is also a comprehensive training course that both inexperienced and veteran police officers can take advantage of to further hone their skills in completing the NJTR-1. Officers attending the Crash Record Refresher course will receive a flash drive containing the new course. This computer- generated training not only provides a detailed explanation of all 149 data blocks on the form, but delivers interactive exercises, videos and challenge questions throughout. At the conclusion of the training module, officers can test their comprehension and knowledge of the NJTR-1 by taking a 25-question quiz. Officers achieving a score of 80% or greater shall receive a certificate of completion generated by the course programming.
Although most of the NJTR-1 Refresher Courses are at capacity, there are still some seats available for officers in Mercer and Camden Counties. Please go to https://test-ru-cait.pantheonsite.io/cait/training to register. Any New Jersey Police Officer interested in receiving a flash drive of the computer-generated course should contact Dave Maruca at dem200@soe.rutgers.edu.

Meet the Instructor: Lloyd Jacobs
You’ve had an accomplished career in transportation, both within the state of New Jersey and across the country. What made you enter this field, and specifically in the public sector?
I had many opportunities available to me, but at the time that I graduated, the Bureau of Public Roads (now FHWA) offered a very intensive and diverse highway training program for three years, with on the job experience across every phase of construction, including planning, design, and traffic engineering. I remember even the Dean of Civil Engineering at Syracuse tried to convince me to stay away from public work and enticed me with a National Science Foundation fellowship to stay and get my doctorate; but ultimately, I knew I was most passionate about construction and the federal government offered the best opportunity for that.
What kind of work did you do for the Federal Highway Administration?
When I first started, the construction of the interstate highway system was in full swing and it was a unique and exciting experience. Quality control and protecting the public interest were our number one priorities, but during my time at FHWA I was in charge of a variety of different departments; planning, engineering, civil rights, environment, you name it. The benefit of being part of such an expansive organization was that it allowed you to make an impact in a lot of different fields.
What accomplishments first come to mind for you?
I am proud of all the work I did all over the country. When I was very young in the Puerto Rico office, I proposed a change to their guiderail design which was met with resistance—but after some persuasion I managed to get it designed, approved, and constructed. To this day it is the design that they use in Puerto Rico. Here in New Jersey, I would say one of my biggest challenges came after I was appointed to be in charge of compliance with our environmental obligations after NEPA. It was brand new policy and a lot of the decisions we made at the time became standards across the country. We developed a nationally recognized compliance review process, implemented noise mitigation measures right here in New Brunswick that were unique to the country, and were the first in the nation to work with the advisory council for historic preservation. NEPA definitely changed the way we did business, as we started to work with other federal and state agencies to move a project forward rather that be the sole decision maker.
Was that a difficult change to get used to?
Nothing in transportation, or government for that matter, is a one-person job. You are always part of a team, and you are always going to have to work with and rely on other people, so it was a good change. Working with other agencies, unions, minority organizations; this is all an important part of the industry. I remember once when I was a very young engineer, I had to meet with the head of Local 825. He was a larger-than-life guy named Tex Holly, who most people didn’t even think would sit down and meet with me, let alone agree to a monumental cooperative working agreement, which started the equipment operator’s apprenticeship here in New Jersey. When you work with other people from a federal perspective, sometimes you have to convince them that not only is it required to do, but it’s the right thing to do. Then, they’ll be eager to work with you.
Were there any people who served as an inspiration to you in your career?
One name that comes to mind is Danny Altobelli. He was a very dynamic person from the Albany office and I believe eventually became division administrator in Connecticut. We worked together often and we had similar characteristics; persistence, proactive, anxious to get results. We cared about doing things right—and doing things on time. As I got started in my career it was important to have the support of someone who was likeminded and supported my efforts.
Since you left FHWA, you’ve held numerous roles including director of planning and engineering for a municipality, some consulting work, and now here at NJLTAP. Do you enjoy being an instructor?
I love it. I’ve taught well over a thousand people and have loved every minute of it. What I enjoy most about my course is that it’s a different type of course; I try my best to motivate the inspectors and administrators who attend. Early in my career when we were tasked with building an entire interstate system, we learned very quickly how important it was to ensure that the public received the product that they paid for, and we knew that if we didn’t do it, no one else would. That is the message that I try to impart more than any other today. The projects may have changed, but the role of the inspector has not.
Thanks for sitting down with us Lloyd, we appreciate it.
My pleasure.
Policies for Safe Road-Sharing
![]()
The Noteworthy Local Policies That Support Safe and Complete Pedestrian and Bicycle Networks publication provides local and state agencies with tools to create a solid policy platform and showcases opportunities to make street networks more complete, livable, and safe for all users. The case studies highlight examples from across the country detailing the policy used along with the special characteristics for the municipality in which it was enacted. Download your copy today from FHWA at safety.fhwa.dot.gov/pedbike/toolssolve/docs/fhwasa17006.
May is Motorcycle Awareness Month
May is Motorcycle Awareness Month and we would like to remind our readers that roadway safety is not restricted to vehicles with four wheels. With the fair-weather months upon us, the chances of motorists interacting with motorcycles on the roadways are likely. According to the Motorcycle Safety Foundation, mot
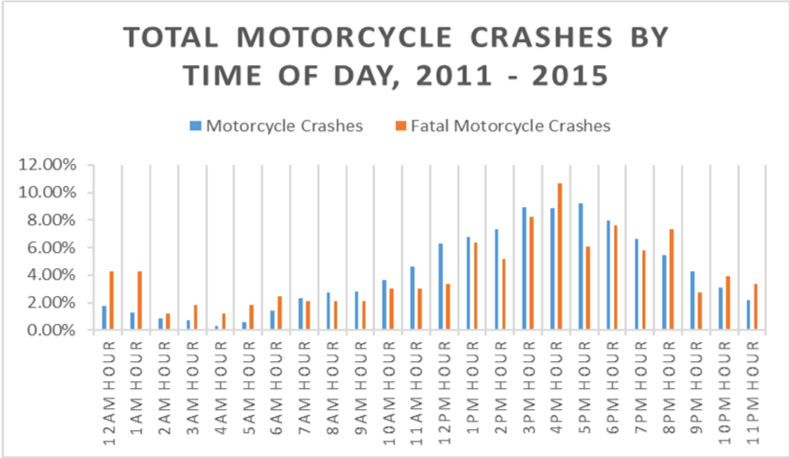
New Jersey data indicates motorcycle crashes are also more predominant in the daylight to dusk hours.
orcycle fatalities have been on the rise an average of 10% per year over the last 20 years. National Highway Traffic Safety Administration (NHTSA) Traffic Safety Facts statistics also show their percentage of overall traffic fatalities and injuries has also had a steady increase. New Jersey has had an average of 2,436 crashes involving motorcycles over the last six years.
Even though motorcycles account for less than 5% of registered vehicles in the US, they are traveling some 21 million miles each year. NHTSA reports that per vehicle miles traveled, motorcyclists were more than 26 times more likely than passenger car occupants to die in a traffic crash. That is an astounding number. New Jersey crash data shows 189 motorcycle fatalities for the three-year period 2014-2016.
Certainly, there are patterns to be found in the crash data for motorcycle incidents. Motorcycle collisions are more likely with fixed objects than other vehicles; however, about 75% of two-vehicle crashes involving motorcycles were motorcyclists colliding with vehicles in front of them. They are more likely to crash with other vehicles turning left, while the motorcycles were going straight, passing, or overtaking passenger vehicles.
NHTSA offers several tips for drivers on how to “Share the Road” with motorcycles
- Allow the motorcyclist a full lane width. Although it may seem there is enough room in the traffic lane for an automobile and a motorcycle, remember the motorcycle needs the room to maneuver safely. Do not share the lane.
- Motorcycles are small and may be difficult to see. A motorcycle has a much smaller profile than a vehicle, which can make it more difficult to judge the speed and distance of an approaching motorcycle.
- Remember that a motorcyclist can be hidden in a vehicle’s blind spot or missed in a quick look due to its smaller size. Always make a visual check for motorcycles by checking mirrors and blind spots before entering or leaving a lane of traffic and at intersections.
- Don’t be fooled by a flashing turn signal on a motorcycle—motorcycle signals may not be self-canceling and riders sometimes forget to turn them off. Wait to be sure the motorcycle is going to turn before you proceed.
Working Smarter, Together
By: Kevin Chesnik and Michael Smith, FHWA Public Roads, Vol. 80 No. 5
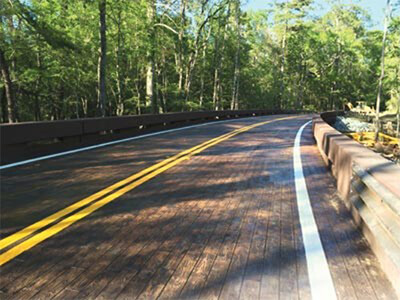
Photo courtesy Florida Department of Transportation
Today’s Federal-Aid Highway Program represents a unique federal, state, and local partnership that is fundamental to building, maintaining, and rebuilding the Nation’s highway and bridge infrastructure. The Federal Highway Administration and state highway agencies have cooperated in implementing the federal-aid program for more than 60 years, and during that time it has grown to include local governments and involve additional federal agencies.
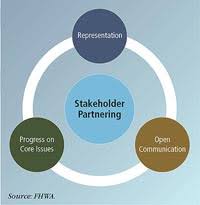
One benefit of stakeholder partnering is good communication that can reduce conflicting responses and differing interpretation of regulations.
Federal-aid program funds come with guidelines from Congress regarding how they may be spent, and federal-aid projects must meet not only federal, but also state and local road-building requirements. Although these high standards have helped create the best transportation system in the world, they may cause projects to take longer to deliver and add to project costs. These increased time and cost issues can make federal-aid projects a challenge for the cities, counties, and other local public agencies that own the majority of the Nation’s roads and half of its bridges. Federal aid can support local public agencies in keeping local roads and bridges, as well as public sidewalks, walking trails, and biking paths, in a state of good repair, but only if it’s cost effective for them to use,” says Brian Roberts, executive director of the National Association of County Engineers. “Complying with the various regulations tied to federal aid can require significant time and resources from local agencies, as well as the state departments of transportation tasked with monitoring those projects.”
One tool that states are using to help save time and money on locally administered federal-aid projects is stakeholder partnering. This method involves creating a committee com-posed of representatives from the state, local, and federal levels who can work together to identify inefficiencies in the delivery of federal-aid programs and create practices that can improve program results and maximize transportation dollars. The many benefits of stakeholder partnering include better communication, lower project costs, reduced administrative burden, and greater compliance with road-building regulations. Stakeholder partnering creates open channels of communication that improve relationships and build trust. As a result, local agencies have a greater say in their projects as they move forward and greater control over their project delivery schedules. State and Federal agencies are able to leverage their programs and maximize the use of limited staffing resources.
Project-Level Issues, Program-Level Solutions
State DOTs develop processes meant to help local agencies navigate the Federal-aid program’s requirements in areas such as consultant advertisement and selection, rights-of-way, the National Environmental Policy Act, Buy America, and Disadvantaged Business Enterprise goals. The challenge is developing processes that are helpful while avoiding burdening staff at the state or local level with administrative requirements that may increase time and costs unnecessarily.
In addition, some local agencies use federal-aid funds only occasionally, so they may not be up to date on the most applicable laws or regulations. Another consideration is agency turnover, as occurs in any place of business. These types of issues are to be expected, but the effects can be mitigated through improved procedures that streamline and bring consistency to project delivery and that stakeholder partnering committees can target.
“The idea is to bring stakeholders together to discuss program-level issues and look for opportunities to resolve them,” Roberts says. “These partnerships give the state and FHWA a better understanding of local concerns–information they can then use to find opportunities for streamlining processes, targeting training, and supporting project success in a way that benefits each agency involved.” When issues are addressed at the program level via process and procedure improvements, it eliminates the need to handle them repeatedly on a project-level basis.
For example, one stakeholder group determined that many local agencies had minimal understanding of environmental requirements and were conducting unnecessary environmental reviews. By recommending specific changes to the state’s environmental manual, the stakeholder partnering committee found a way to accelerate simple bridge projects.
As with other EDC innovations, stakeholder partnering is already in place and working effectively in several states and has the potential for successful implementation in many more.
In the Federal-aid program, relationships between local public agencies and FHWA occur primarily through state DOTs. When state, local, and federal representatives sit down at the same table, however, it provides new lines of communication that increase understanding of federal-aid and state requirements and each agency’s role, resources, and limitations.
“One benefit of stakeholder partnering is good communication that can reduce conflicting responses and differing interpretation of regulations,” Roberts says. “It provides a setting from which discrepancies can be identified and then resolved. It really supports a consistent approach.”
Some states have had stakeholder committees supporting improved project delivery for many years, while others are just getting started. The committee makeup and meeting arrangements vary by state, but successful partnerships have three common elements: representation from key stakeholders at the state, local, and federal levels; open communications through regular meetings that promote a shared understanding of programmatic issues; and tangible progress on addressing issues identified by stakeholders.
Stakeholder Partnering Supported by Every Day Counts
Stakeholder partnering was one of the 11 innovative practices promoted in the third round of FHWA’s Every day Counts Initiative to improve delivery of federally funded projects. As defined within EDC, stakeholder partnering is a process where collaboration occurs among federal, state, and local agencies at the programmatic level to address concerns and issues, as well as to take advantage of opportunities for process improvements and streamlining. The intent is not to debate the merits of federal regulations, but rather to rather to focus on efficient and effective implementations. As of February 2017, stakeholder partnering is an institutionalized practice in 21 states including New Jersey.
EDC-4: Pavement Preservation
![]() In a time of rising costs and tightening budgets, maintaining the integrity of our state roads requires long term planning and comprehensive solutions. Regardless of the type of materials used to create highway pavement, traffic loads and environmental elements will lead to the deterioration of the system. Indeed, estimates are that after only 15 years, the condition of an untreated road drops nearly 50 percent. Once a road reaches this “point-of-no-return,” it becomes more costly to maintain and full rehabilitation becomes the only real option.
In a time of rising costs and tightening budgets, maintaining the integrity of our state roads requires long term planning and comprehensive solutions. Regardless of the type of materials used to create highway pavement, traffic loads and environmental elements will lead to the deterioration of the system. Indeed, estimates are that after only 15 years, the condition of an untreated road drops nearly 50 percent. Once a road reaches this “point-of-no-return,” it becomes more costly to maintain and full rehabilitation becomes the only real option.
So, what can you do to avoid the choice between deteriorating roads and expensive overhauls? The FHWA Every Day Counts initiative posits pavement preservation as a practical, low cost strategy to reduce costs and improve quality. Using whole-life planning for pavements focusing on the 3R’s—the right treatment, the right pavement, at the right time—has shown to be a proven methodology to extend pavement life.
Focusing on improved construction of pavement preservation has highlighted treatment materials, construction practices, improved specifications, and better equipment have been effective on a variety of pavement surfaces. Whether its flexible pavements using chip seals, micro surfacing slurry seals or rigid pavements using techniques like dowel bar retrofits, patching, and diamond grinding, service life has been extended and costs reduced. FHWA has partnered with state departments of transportation to identify best practices and highlight the most effective and implementation ready approaches from around the country.
Check out the EDC-4 project page for all the information on pavement preservation, and the methods that are the best fit for your agency.
You can find the Pavement Preservation Implementation plan and fact sheet at fhwa.dot.gov/pavement/preservation. FHWA’s site has information on bridge preservation, state sources, manuals, and special projects, as well as fact sheets and operating guidelines that have proven effective elsewhere. Find out what your agency needs to do to extend pavement life, improve safety, and meet motorist expectations for a lower cost.

Photo: ©NJ Transit
Infrastructure Improvements: NJ Transit Planning Hudson-Bergen Light Rail Expansion
NJ Transit is exploring the opportunity to expand the Hudson-Bergen Light Rail (HBLR) line with seven new light rail stations in Hudson and Bergen Counties, including Secaucus, Ridgefield, Palisades Park, Leonia and Englewood.
The HBLR first began its operations in Jersey City 17 years ago, and currently serves 24 stations through six Hudson municipalities, including Weehawken, Union City, North Bergen, Jersey City, Hoboken, and Bayonne. The HBLR in these municipalities creates linkages to other major public transit options, such as NJ Transit trains and buses, the PATH, and Hudson River ferries to Manhattan. NJ Transit’s light rail operation in Hudson County is one of the most successful in the nation and according to NJ Transit, “the light rail system now serves 51,867 riders daily,” and an extension of the Northern Branch “would add an estimated 12,370 riders to that number by 2030.” However, despite its success, the HBLR still does not reach any municipalities in Bergen County.
In addition to the expansion into Bergen County, NJ Transit also wants to create an extension in Jersey City to Route 440 and plans to make these improvements through a 10-mile CSX railroad right of way between North Bergen in Hudson County and Englewood Hospital in Bergen County. The Jersey City extension has been posed as a beneficial connection to the Hackensack Riverfront, where it would connect to a proposed Bayfront development that includes mixed-use housing, retail, office space, and public parks.
The light rail expansion project shows long-term planning as our transportation infrastructure and public transit options near capacity, and it puts an emphasis on the importance of mass transit planning in the most densely populated region in the nation. Existing commuters may see a cut in their commute time and have more convenient options for mass transit other than the bus or train.
Improving mass transit opportunities provides improved access and mobility not only for commuters, but likewise to redeveloping areas and existing commercial corridors in these local areas. As an example, in Bergen, extending the HBLR to the Englewood Hospital in Bergen would provide new commuting opportunities to a pool of future hospital employees and other area workers. It will likewise provide additional economic gains for both Hudson and Bergen Counties as the line helps to attract new businesses and support future employment and residential growth. In addition, the extension would benefit “low-income and minority transit riders in commuting to regional jobs, and other job centers in the Meadowlands, Hudson River waterfront area, and New York City”. On top of job growth, the expansion has the potential to boost home values for local residents and impact the vitality of commercial districts in local downtowns. A study by Rutgers economist Michael Lahr found that “the existing Hudson-Bergen Light Rail line demonstrably increased housing values in Hudson County and the thriving downtowns…on NJ Transit’s Midtown Direct line to Manhattan are testimony to the impact of transit-oriented development.” Overall, an extension of the HBLR after 17 years would not only promote a commitment to functional mass transit in the region, but it will likewise provide a greatly needed economic boost to the municipalities in Bergen County.
Roadway Safety Spotlight: Longitudinal Rumble Strips and Stripes
A roadway departure (RwD) crash is defined by the Federal Highway Administration (FHWA) as “a crash in which a vehicle crosses an edge line, a centerline, or otherwise leaves the traveled way.” These crashes, comprising run-off-road (ROR) and cross-median/centerline head-on collisions, tend to be more severe than other crash types. In 2013, RwD crashes accounted for 59 percent of all motor vehicle traffic fatalities. There are a number of reasons a driver may leave the travel lane, including an avoidance maneuver, inattention or fatigue, traveling too fast with respect to weather or geometric road conditions.

Sample of installed milled shoulder rumble strips (SRS). Photo ©Neal Hawkins
Over the past few decades, different engineering countermeasures have been proposed, implemented, and tested by various state and local agencies to mitigate RwD crashes. These countermeasures include but are not limited to: installation of longitudinal rumble strips and stripes, elimination of shoulder drop-offs, enhancement of pavement markings, and removing and relocating objects within roadside clear zones. Longitudinal rumble strips include a series of milled or raised elements on the pavement. Tires rolling over rumble strips generate noise and vibration which alert a distracted or drowsy driver to make a safe steering correction. Centerline rumble strips and shoulder rumble strips are examples of applications that can be implemented on two-lane roads.
Centerline Rumble Strips
Centerline rumble strips (CLRS) are a longitudinal safety feature that can be installed at or near the centerline of undivided roadways (Figure 1). The CLRS can be implemented by means of a single or double line of rumbles. It should be noted that the centerline pavement markings are typically installed on the rumble strips, which are also known as centerline rumble stripes. The CLRS are typically used as a treatment to reduce the single-vehicle RwD crashes and multi-vehicle cross-centerline crashes, which are some of the most severe crash types.
Sample of installed milled centerline rumble strips (CLRS). Photo ©Neal Hawkins
Additionally, the CLRS help drivers keep the vehicles within travel lanes in poor-visibility conditions such as rain, fog or snow. In 2012, longitudinal rumble strips and stripes on two-lane roads became one of the FHWA’s nine proven safety countermeasures. Moreover, the FHWA developed some recommendations on CLRS installation, accommodation, and mitigation. According to the National Cooperative Highway Research Program (NCHRP) report results, the number of head-on fatal and injury crashes dropped by 44 percent and 64 percent for rural two-lane roads and urban two-lane roads, respectively.
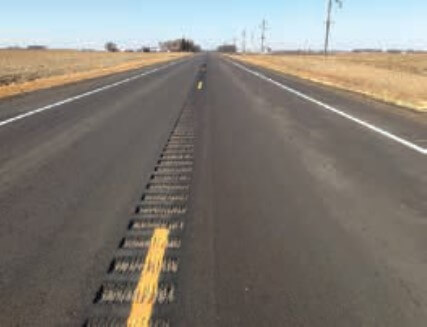
Centerline Rumble Strips
Shoulder rumble strips (SRS) are usually installed in paved shoulders that are adjacent to the travel lane (Figure 2). Similar to CLRS, SRS provide acoustical and vibrational warnings to drivers who are straying from their travel lane. To enhance the visibility or accommodate narrow shoulder conditions, SRS can be painted with edge line markings, commonly known as edge line rumble stripes. Installation of SRS on two-lane roads is on FHWA’s most recent proven safety countermeasures list. According to survey results from 50 state departments of transportation (DOTs), the benefit-to-cost ratio for SRS was estimated to be approximately 50:1. Moreover, based on the NCHRP Report 641: Guidance for Design and Application of Shoulder and Centerline Rumble Strips, installation of SRS on rural two-lane roads reduces the number of run-off-road fatal and injury crashes by nearly 36 percent.
Regarding rumble strip maintenance, it should be noted that all rumble strips are typically self-cleaning. It means that snow/ice/rain or sand do not usually remain for any length of time due to the wind caused by passing vehicles. Moreover, milled rumble strips typically need little to no maintenance. To be specific, several state DOTs (e.g., Missouri DOT, Pennsylvania DOT, South Carolina DOT, and Washington DOT) reported no use of preventative maintenance techniques on their rumble strips.
Technical Assistance Now Available for Data Business Planning to Support State, Tribal, and Local Safety Data Integration!
By: Stuart Thompson, FHWA Office of Safety, and Robert Scopatz, VHB
 Under the Fixing America’s Surface Transportation (FAST) Act and associated FHWA rulemaking, States are required to have in place a safety data system that can be used to perform analyses supporting the strategic and performance-based goals in the SHSP and HSIP on all public roads. Further, states are required to incorporate specific, quantifiable, and measurable anticipated improvements for collection of Model Inventory of Roadway Elements (MIRE) Fundamental Data Elements (FDE) into their State Traffic Records Strategic Plan update by July 1, 2017, [23 CFR 924.11(b)].
State, tribal, and local agencies are now challenged to develop a fully linked system that includes essential data elements, provides geolocation data, includes the FDE subset of the MIRE, and has analysis and evaluation capabilities.
The FHWA Office of Safety intends to provide agencies with technical assistance to help meet these requirements.
FHWA is currently seeking state, tribal, and local agencies interested in submitting project ideas for technical assistance implementing safety data integration to support safety decision making. Ideal projects will illustrate one of the following:
- State-led data collection.
- Tribal-led data collection.
- Local agency-led data collection.
- Other support agency (LTAP, TTAP, MPO, RPC) approach.
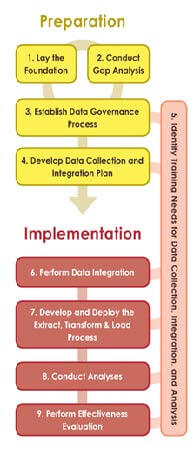
Selected state, tribal, and local agencies will have the chance to participate in demonstration projects to energize agencies with similar interests and challenges. FHWA will select up to seven projects with the intention of assisting agencies in implementing the first five steps of the nine-step safety data integration process shown. At the conclusion of the projects, agencies will receive a clearly defined plan for implementing the remaining four steps.
If your state, tribal, or local agency is interested in learning more about the opportunity–or would like to submit a project for consideration–please contact your FHWA Division Office Safety Engineer.
New Jersey “Build a Better Mousetrap” Competition Open
People involved in the transportation industry often find better ways to do their jobs. Whether it’s a new gadget that improves the quality and safety of a project, or an innovative process that reduces costs and improves efficiency, it is typically the people on the front lines that often realize the latest and best practices.

Build a better mouse trap, and the world will beat a path towards your door. – Ralph Waldo Emerson
Now is the time to share those new ideas with others in New Jersey’s Build a Better Mousetrap Competition. We are looking for submissions from any employee of a local or state public agency (municipalities, counties, parks commissions, NJ Department of Transportation, NJ Transit) that has created an alternate or better way of doing something in a transportation project. We will gather the best ideas from around the state and judge them using a 5-point rating system. If you have something you think would qualify for this competition, submit your entry by June 1, 2017. As a reminder, this competition is open to any local, county, or state transportation agency, including New Jersey Department of Transportation and New Jersey Transit employees. Two winners will be selected; one for the best local agency and another for the NJDOT/NJT Submission. Visit cait.rutgers.edu/njltap/2017-build-better-mousetrap-competition for more information and to download the entry form today!
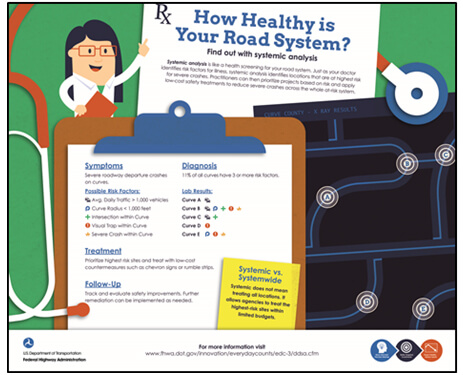
Image: USDOT EDC
Data-Driven Safety Analysis: A Health Check Up on Your Roadways
Data-Driven Safety Analysis (DDSA) made great strides under Every Day Counts 3 (EDC-3) initiative, with more than 40 states applying DDSA on one or more projects in the areas of planning, alternatives analysis, design, and operations. Interest in DDSA has remained so high, that it was selected as one of the innovations to continue under EDC-4. Now that states have tried it, many state DOTs and local agencies have set their sights on integrating DDSA into their policies and procedures throughout their respective project development processes.
Planning is one of the areas in which we’ve seen progress in applying DDSA. Predictive and systemic analysis tools can be applied early in the project development process to help identify which roadways aren’t performing as they should, determine the scope and need of potential projects, and prioritize them. For example, the Ohio Department of Transportation is incorporating data-driven safety analysis into its project development process so that safety will be considered in all project planning – from minor resurfacing to major construction projects. The agency created safety-integrated project maps that identify priority locations where safety improvements should be considered on projects that overlap these areas.
The Colorado Department of Transportation is another state that’s performing a safety analysis of all its projects as part of a transportation systems management and operations (TSM&O) evaluation. This evaluation process compares existing safety performance of a project location with how that particular roadway was expected to perform. Projects with a high potential for safety improvement are then scoped accordingly to address the identified safety issues.
The good news is that identifying roadway sites with the greatest potential for safety improvement doesn’t have to be overly complicated. In fact, many state and local agencies have accomplished this by implementing the systemic approach to highway safety. For those not familiar with the systemic approach, it’s really similar to how doctors provide care to their patients. First, they inquire about your family health history, your personal health history, and your behavior (including exercise, diet, etc.). They then use this information to assess your risk of developing certain diseases and proactively work to minimize that risk before major issues develop later in life.
Similarly, we can perform “health assessments” on our roadway systems using these steps:
- Identify target crash types (e.g. severe roadway departure crashes).
- Identify focus facility types (e.g. two-lane rural roads with curves).
Identify and evaluate risk factors (e.g. curve radius, traffic volume, intersection within curve.) We can then proactively treat locations that surpass the threshold for crash risk with low-cost countermeasures.
For more information on the systemic approach, visit http://safety.fhwa.dot.gov/systemic/.
Did You Know? Work Zone Safety Facts

Image: USDOT EDC
- In 2015, more than 700 deaths and 35,000 injuries occurred in work zones.
- More that 80% of the people killed in work zones nationwide are passengers and drivers.
- A car traveling at 60 miles per hour travels 88 feet per second. If you pass a “Road Work Ahead” sign at 60 miles per hour, you will reach that work zone in just 17 seconds.
- Almost 30% of all work zone crashes involve large trucks. Be extra careful when navigating work zones around large vehicles.
- The top two reasons for crashes in work zones were inattentive driving and speeding; pay attention to the orange signs and reduce your speed! Your life and others depend on it.
none stock
Learning About OSHA’s New Silica Standards
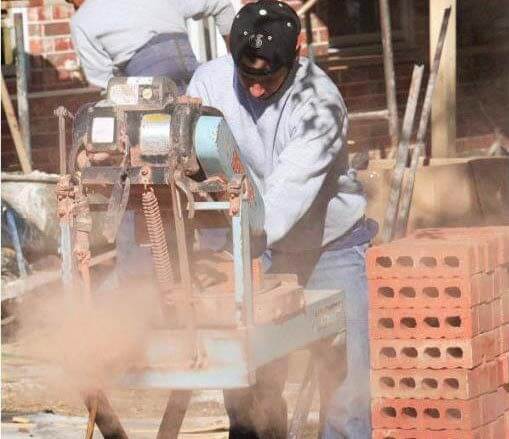
Every year workers in the United States are exposed to harmful chemicals and toxins that can cause serious illness, and sometimes death. To mitigate the effects of exposure and to ensure all workers have access to safe and healthy workplaces, the United States Department of Labor’s Occupational Safety and Health Administration (OSHA) has issued new standards to reduce these risks. One particularly harmful material that serves as a common component in many everyday items is crystal-line silica.
Crystalline silica is found in construction materials such as brick, concrete, rock, stone, and mortar. The silica is especially harmful during the manufacturing of these materials, where activities like cutting, sawing, drilling, crushing and pulverizing of these materials produce respirable crystalline. Respirable crystalline silica is a uniquely hazardous mineral for our nation’s workforce, where the smallest amount inhaled into a person’s lungs can cause serious, and sometimes fatal diseases like silicosis, lung cancer, kidney disease, and chronic obstructive pulmonary disease (COPD). An estimated two million construction and 300,000 general industry operational workers in the United States are exposed to silica.
In an effort to protect workers from this dangerous material, and based on years of research, review, and public comment, OSHA has finalized two new silica standards. The rules reduce the amount of silica dust that workers can be exposed to on the job, requiring employers to implement workplace best practices to and implement widely-available equipment with water or vacuum systems deemed safe for work. High exposure areas will be clearly identified, limited in access, and workers will be provided with respiratory protection when other options are not effective. Other standards that are in effect are:
- Exposure limit: The new permissible exposure limit (PEL) is reduced to 50 μg/m3 averaged over eight hours shift.
- Scheduled sampling: Perform initial sampling to determine which tasks cause exposure above the action level (AL), then conduct periodic sampling afterwards.
- Exposure control plan: Establish and implement a required written exposure control plan that involves exposure and methods used to protect workers, including procedures to restrict access to work areas.
- Medical exams: Comprehensive physical exams, including chest x-rays and lung function tests, is required every three years (at no cost to employees) to any worker who must wear a respirator for 30 or more days a year due to silica exposure.
- Training: Employers must include silica exposure in their Hazard Communication program and relay information on its effects and procedures to prevent overexposure.
- Cleaning: A high-efficiency particulate air (HEPA) vacuum and/or the use of wet methods is required. Poor housekeeping practices such as compressed air, dry sweeping and dry brushing are prohibited.
- Recordkeeping: Records must be kept of air monitoring, objectives, and medical/exposure surveillance.
For more information and to view Table 1: Specified Exposure Control Methods When Working with Materials Containing Crystalline Silica, go to www.lhsfna.org/index.cfm/controlling-silica-exposure
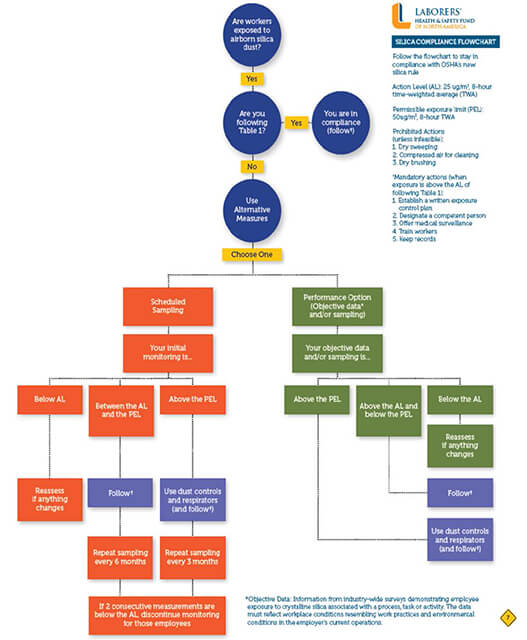
Source: Laborers’ Health & Safety Fund of America.