In this Issue:
From the Director: NJ LTAP on the Move
New Jersey LTAP prides itself on the technology transfer services we provide to thousands of people who have attended our trainings. Customer service remains our primary goal, and each day we do our best to ensure New Jersey’s transportation professionals are highly trained and equipped to do their jobs.
To that end, we have released the 2017 NJ LTAP Customer Needs Survey. We want to hear back from you about how we have done, what we can do better, and about the future services you would like to see offered by NJ LTAP. This survey will help us collect information from the people who will be impacted the most by new course offerings, online training, and resource development. Please take this survey; in the end, our goal is to deliver the best possible product to you!
Thank you,
Janet Leli, Director
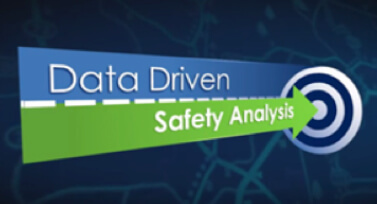
Data Driven Safety Analysis: Adding a Local Focus in EDC-4
By using data-driven safety analysis, (DDSA), States were able to achieve great success in the third round of the Every Day Counts (EDC-3) initiative. More than 40 States applied DDSA tools on one or more projects, and the DDSA team is responding to 145 assistance requests from 44 States. FHWA has conducted 7 peer exchanges involving 35 States and has delivered 35 Highway Safety Manual-related training sessions to 26 States, with 14 more currently scheduled.
But there is still work to do. Fortunately, DDSA has been selected to continue in the fourth round of EDC (EDC-4). In EDC-4, the DDSA team will continue to assist States as they incorporate predictive and systemic analysis into their projects, policies, and procedures. Our goal is to see 47 States demonstrate DDSA by the end of round four (December 2018), and we will offer the same level of training and technical assistance that we did under EDC-3 to help them get there.
 For this round, we have enhanced our approach and included an additional focus: helping local agencies.
One of our goals is to identify and increase the number of local agencies with local road safety plans. The plans incorporate DDSA approaches and help the agencies identify which sites on their systems have the most potential for improvement; they act as a road map for targeting safety investments.
One of the agencies that has worked closely with its local government partners is the Minnesota Department of Transportation, which created road safety plans for each of the State’s 87 counties and even shared funding with the local agencies to help them implement low-cost countermeasures. This effort has the added benefit of allowing the DOT to expand a culture that embraces a systemic approach to safety countermeasures throughout the State’s transportation community. You can watch a video about the project here: https://www.youtube.com/watch?v=jVds3AWWqbk&t=49s.
The DDSA team is also striving to increase the number of local projects incorporating DDSA and raise the percentage of Highway Safety Improvement Program (HSIP) funds that are applied to local roads. HSIP is a data-driven program, and DDSA tools can help agencies to quantify the expected safety impact of design decisions so they can generate benefit/cost ratios with confidence and better compete for funding. An example of this is a recently completed effort in Burlington County, New Jersey. County officials, with assistance from the Delaware Valley Regional Planning Commission, the New Jersey Department of Transportation, and the FHWA performed a predictive safety analysis for potential intersection improvement alternatives. This support made it possible for the county to acquire HSIP funding to construct a modern roundabout. View a video of the story here: https://www.youtube.com/watch?v=cHv086TQ2LI&t=9s.
E-Construction Speeding up Projects for State DOTs
In the United States, many aspects of daily life—for purposes of both business and pleasure—involve cell phones, tablets, laptops, and other mobile devices. Today you can do just about anything online, from ordering lunch to applying for a mortgage. However, some aspects of highway construction and program implementation have resisted this evolution of “going electronic”—until now. Known for having lengthy delivery times, highway projects historically involve paper plan sets, paper documentation, and wet-ink signatures for contract documents and other approvals. Even with the introduction of computer-based management systems in recent decades, transportation agencies and contractors still print much of the documentation that is developed originally in electronic format simply because it is standard procedure.
Recently, the highway industry started revolutionizing how it does business to deliver projects more efficiently. The Federal Highway Administration and State Departments of Transportation are adopting e-Construction as a tool to reduce paperwork and associated costs, improve communication and environmental sustainability, and facilitate more efficient project delivery. “We took a look at inefficiencies with the traditional paper-based system and quickly realized things can be done better and faster,” says Tom Everett, associate administrator for the FHWA Office of Infrastructure.
 Why It Works Better
e-Construction is a delivery process for construction management that includes electronic submission of all construction documentation by all stakeholders, electronic document routing/approvals (e-signatures), and digital management of all construction documentation in a secure, paperless environment. The process enables distribution and access to all project stakeholders through mobile devices. “It’s doing all of this in a real-time environment,” says Everett. “The contractor has portions of this electronic process that they interact with, the material suppliers also do, and the State does as well—all in a secure environment. So you know where all of the documents are, and you have reliability associated with them.”
e-Construction employs many tools, technologies, and practices. Examples include mobile devices, software, and applications for field inspection and data collection; data hosting services such as data clouds, share sites, and virtual review rooms; and communications tools such as email, text, social media, Skype™ and FaceTime®, and other smart technologies. Practices include the transfer of electronic plans and electronic contract specifications and special provisions; electronic review and digital approval processes with transparency; real-time tracking using resources such as radio frequency identification (RFID) tags, quick response (QR) codes, bar coding; and asset management including electronic as-built drawings and quality assurance.
e-Construction has piqued national interest because of its many benefits. State DOTs are realizing time and cost savings, enhanced quality, and improved data availability from e-Construction. States are mainstreaming many e-Construction system practices and showing significant returns on investment. Through enhanced awareness and promotion of benefits and examples of e-Construction application, the highway industry is ready to reap the benefits of program-level implementation.
Learn more about e-construction, and about how you can move from innovation to practice.
Simple Changes on Local Roads: See How One State Has Made a Big Difference in Their TZD Efforts
Of Ohio’s 121,342 center lane miles, 41,456 of them, or 34 percent of Ohio’s entire roadway system, are the responsibility of Ohio’s townships. Why is this important to roadway safety in Ohio? Because if we don’t make efforts to help improve safety on the largest percentage of our roadway system, we will never get to Zero Deaths.
The struggle in Ohio was not whether safety funds would be spent making safety improvements on townships roads–we knew it had to happen to keep Ohio moving Towards Zero Deaths (TZD)–but in determining what type of improvement(s) would be best targeted to township roads. Why? Because even though they account for the largest percentage of Ohio’s center lane miles, they also carry the least amount of traffic volume on Ohio’s system.
In late 2012, the Ohio Department of Transportation’s (ODOT) Office of Safety partnered with Ohio’s Local Technical Assistance Program (LTAP), also based at ODOT, to identify a safety countermeasure it felt would meet the safety needs on Ohio’s township roads. The selected countermeasure was to target horizontal alignment signs and intersection signs for replacement or to install additional signs where warranted. New or replacement signs were all to meet the current retroreflectivity guidelines, but, just as important, the new signs were to be larger than those currently in place. Increasing sign visibility through larger, more reflective, and additional signage was the plan to get Ohio’s township roads moving TZD—and it worked!
While the program has been in place now for 4 years, ODOT was just recently able to begin analyzing the township roadway crash decreases. ODOT analyzed 24 townships which had at least 12 months of data following the signage installation and found that township crashes dropped from just over 1,443 crashes per year down to 1,294—a reduction of more than 10 percent. Serious injuries decreased from 39 to 25, nearly 36 percent, and, last but certainly not least, township fatalities dropped from 4.67 per year to zero–a 100 percent reduction.
These reductions represent a $32.7 million savings in comprehensive societal costs between the before and after periods for the 24 townships. A total of $522,924.29 was spent on the townships, resulting in a benefit/cost ratio of 62.59.
Read more about Ohio’s cost saving innovations at FHWA’s Safety Compass
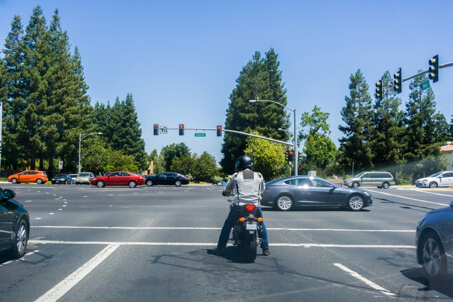
Sharing the Road with Motorcycles
Per vehicle mile traveled, motorcyclists are about 35 times as likely as passenger car occupants to die in a motor vehicle crash, and eight times more likely to be injured. While there are a number of things motorcyclists can do to enhance their own safety, a large number of these collisions occur with other vehicles who are unsure of how to navigate the road around a motorcycle. To remedy this, the Washington Motorcycle Safety Program released a video to raise awareness about sharing the streets. This eight minute video follows a teen driver who gets a “crash course” lesson in how to deal with motorcyclists, from a person he just hit with his vehicle. The video focuses on important facts to remember, and best practices to avoid future accidents. The lessons can be broken down into three key lessons for other drivers:
Visibility – Motorcycles are narrower and smaller than other vehicles. This means it’s hard to pick them out of the background when they are coming head on, and as such, makes it harder to judge their speed and distance. Also, smaller headlights and taillights make it more difficult to determine when a vehicle is braking. They can disappear and reappear in and out of blind spots easier than other cars. While some riders wear bright colors to help be identified, many also where black; being on the lookout for both is critical to remaining safe.
Since motorcycles are not as common as cars, many times drivers don’t expect to see them. When you don’t expect to see something, sometimes it’s easy not to register its appearance, even when it’s right in front of you. Try this awareness test to see how easy it is to miss things in plain sight when they are out of mind.
Vulnerability – Motorcycle riders are exposed far more than passenger vehicles and are therefore vulnerable to everything. An accident that would lead to a small dent for a passenger vehicle could easily be fatal for motorcyclist; they have no airbags, steel cages, seatbelts, or crumple zones. Regardless of the nature of the accident, a motorcyclist will almost always be more seriously injured. Furthermore, weather hazards like rain and snow, or poor pavement conditions or gravel roads also reduce the amount of control a motorcyclist has. Be sure to exercise extra caution under these conditions.
Maneuverability – Motorcycles have faster acceleration and braking than passenger vehicles, meaning the typical start/stop times you are expect are typically shortened. Riders will also change position in roadways, in an attempt to be seen better, but this leads to its own hazards as well. Even though a motorcycle may be smaller than a vehicle, they are still entitled to the entire lane. Often times passenger vehicles encroach on motorcyclists in ways they would not do for passenger vehicles. Always leave plenty of room between your vehicle and motorcycles.
Please, watch and share this video with your friends and family. You don’t have to be a motorcyclist to learn about the importance of sharing the road.
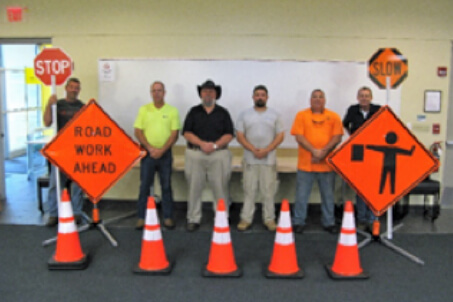
2017 Winners of Work Zone Safety Equipment Set Giveaway
Rutgers Center for Advanced Infrastructure and Transportation, with the support of the Division of Highway Traffic Safety, has once again awarded work zone safety equipment sets to five public works departments. Several municipalities from around the state submitted request forms outlining their needs for the safety equipment. To be eligible, the departments had to articulate how their safety equipment was compromised by fire, theft, flood, wind damage, age or other natural disasters.
The following five public works departments received work zone safety sets based upon their submissions:
- Morris Township
- City of Bayonne
- Pennsauken Township
- Readington Township
- Middletown Township
The work zone safety equipment provided meets the minimum standards as per the Manual on Uniform Traffic Control Devices when closing one lane on a two-lane roadway for a flagging operation. Each department received:
- Two Class 2 high-visibility vests with reflective stripe
- Two roll-up “Road Work Ahead” signs
- Two roll-up “One Lane Road Ahead” signs
- Two roll-up flagger symbol signs
- Six compact sign stands
- Twenty orange traffic cones with retroreflective stripes
- Two Stop/Slow paddles
Congratulations to the winners and thank you for making work zone safety a priority in New Jersey!
A Focused Approach to Pedestrian and Bicycle Safety
In 2015, the most recent year for which data is available, 5,376 pedestrians and 817 bicyclists were killed on U.S. roads—the highest numbers since the mid-1990s. Although pedestrian fatalities had been trending downward for many years, they have been increasing since 2009. Walking and bicycling are vital to all communities, and the Federal Highway Administration recognizes the importance of addressing safety for these vulnerable road users.
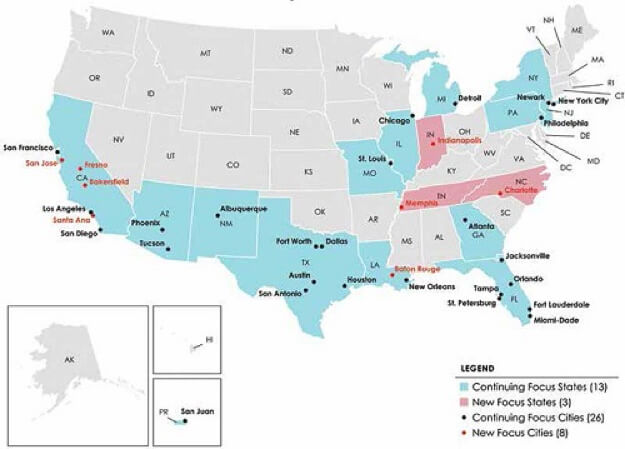
For more than a decade, FHWA’s Office of Safety has delivered a targeted training and technical assistance program to cities and states with the highest number of pedestrian fatalities. In 2015, FHWA revised the program to emphasize both pedestrians and bicyclists. FHWA updates the program, known as the Focused Approach, with new focus cities and states approximately every 5 years, based on the most current fatality data. When FHWA most recently reevaluated the program in 2015 (using 2013 data), the focus cities accounted for approximately 18 percent of all pedestrian and bicyclist fatalities in the United States.
As a leader in the conversation, FHWA is helping to create a consensus between state and local transportation agencies about how to improve pedestrian and bicycle safety. FHWA provides training and technical assistance to help demonstrate the need to address safety and determine how to move the conversation forward at the regional and state levels.
No two agencies are alike, and each participating city and state faces distinct challenges that require a tailored approach to identifying and addressing problems. Read on to learn how three participants in the program—the city of Chicago, the North Central Texas Council of Governments, and the State of Florida—have used different strategies for implementing comprehensive, safety-focused programs to reduce pedestrian and bicyclist injuries and fatalities.
Safe Transportation for Every Pedestrian (STEP) Webinar Recording Available Online
Pedestrians account for over 17.5 percent of all fatalities in motor vehicle traffic crashes, and the majority of these deaths occur at uncontrolled crossing locations such as mid-block or un-signalized intersections. These are among the most common locations for pedestrian fatalities generally because of inadequate pedestrian crossing facilities and insufficient or inconvenient crossing opportunities, all of which create barriers to safe, convenient, and complete pedestrian networks.
Expecting pedestrians to travel significantly out of their way to cross a roadway to reach their destination is unrealistic and counterproductive to encouraging healthier transportation options. By focusing on uncontrolled locations, agencies can address a significant national safety problem and improve quality of life for pedestrians of all ages and abilities. STEP is also an important action in FHWA’s Strategic Agenda for Pedestrian and Bicycle Transportation, which is a collaborative framework for pedestrian and bicycle planning, design, and research efforts being developed over the next five years.
This EDC-4 effort will help more communities deploy these pedestrian safety improvements based on their specific roadway contexts and needs. It also aligns with U.S. DOT’s Safer People, Safer Streets initiative and with other U.S. DOT efforts such as Ladders of Opportunity, which aims to provide people with safe, reliable and affordable connections to employment, education, healthcare and other essential services. Recently a recording of a webinar about Safe Transportation for Every Pedestrian was held online.
For your convenience, a recording of this webinar can be found here. Find out new ways to not only introduce these initiatives, but also make them salable for partners all over the country.
Colorado DOT Tests Self-Driving Work Zone Vehicle
The Colorado DOT has unveiled a first-of-its-kind work zone vehicle designed to keep roadway maintenance crews safe. Typically, crash cushion trucks are positioned behind construction crews in order to protect workers from vehicles moving around work zones. Now, CDOT has unveiled an Autonomous Impact Protection Vehicle (AIPV) that takes the driver out of the vehicle.
Since the purpose of the crash cushion trucks is to absorb the damage of crashes in the first place, it only makes sense to remove the driver from this vehicle. The AIPV is linked to another human-driven vehicle and follows it precisely with GPS technology.
New Jersey Attends National LTAP Conference
Members of the New Jersey Local Technical Assistance Program, along with their Project Manager from the New Jersey Department of Transportation, recently attended the 2017 National Local Technical Assistance Program Conference in Portsmouth, VA. The annual event, held July 17-20, featured professional development workshops and updates from the Federal Highway Administration (FHWA) Center for Local Aid Support.
Among the conference highlights were breakout sessions with partner organizations, such as the National Transportation Training Directors and the National Association of County Engineers. NJ LTAP staff attended multiple sessions on communications, workforce development, innovation, and roadway safety; the NJ LTAP team also participated as presenters, moderators, and in the poster session. The conference was an excellent opportunity to share best practices with other LTAP centers and interact with the FHWA central administration for the program.

There’s an App for That!
In today’s world, telephone apps are on everyone’s phone and help us do a variety of things, whether it is games, calculators, or social media programs. But did you know that there are apps that are designed specifically for you to do your job better?
Productivity apps are nothing new, of course. However, there are a series of apps now available to help transportation professionals do their jobs or help motorists report accidents. We’ve collected a list below of some of the best transportation productivity apps across Android and Apple platforms. These apps can help you do anything from calculating sand, salt and asphalt aggregates, tracking storm damage, calculate slopes, or setup work zones safely.