In this Issue:
Share Your Ideas with Ideascale
Free for the Asking
Automated Speed Enforcement Cameras in Work Zones
Low-Cost Safety Enhancements for Stop-Controlled Intersections
Staying Fit for Snow Fighting
USDOT New Automated Driving Systems Guidance
OSHA Updates, Centralizes Silica Standards Online
From the FHWA Office of Safety: Safety PM
Meet the instructor
Early Action Steps in Groundbreaking at Portal North Bridge as Gateway Program Gets Underway
Safe Transportation for Every Pedestrian (STEP) EDC4 highlights
FHWA Launches the Strategic Highway Safety Plan Database
USDOT Announces $500 Million Funding Opportunity via TIGER Program
Did you know…?
ITS is Changing the World
Share Your Ideas with Ideascale
We are happy to share with you that the New Jersey Department of Transportation’s Bureau of Research has launched a new research collaboration site to seek out practical solutions to transportation related issues that affect the safety, mobility, and accessibility of New Jersey residents, workers, visitors, and businesses. The site includes a portal for submission of research ideas from NJDOT research customers and other transportation stakeholders.
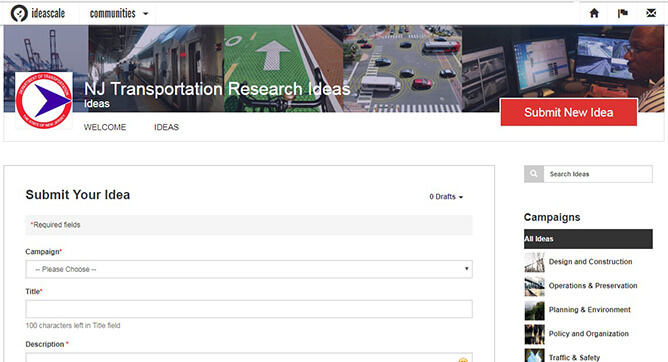
none-screenshot
The next round of research ideas that may evolve into requests for proposals will be closing December 31, 2017. Research ideas will be prioritized by the NJDOT Research Oversight Committee after the submissions are received. Research ideas may be submitted by NJDOT research customers and other interested transportation practitioners. Ideas will require a “champion”, someone who is holding a responsible position within a unit of NJDOT, who is prepared to sponsor or advance a research idea from its inception to study completion.
To register to submit ideas or vote on other ideas to show support, please visit njdottechtransfer.ideascale.com/. If you have questions regarding registering, please email ideas@njdottechtransfer.net
Free for the Asking
The New Jersey Local Technical Assistance Program has a limited number of NHTSA’s new Model Minimum Uniform Crash Criteria on USB drives. The MMUCC 5th Edition is the result of an 18-month collaboration between NHTSA, the Federal Highway Administration (FHWA), the Federal Motor Carrier Safety Administration (FMCSA), the National Transportation Safety Board (NTSB), the GHSA, and subject matter experts from State DOTs, local law enforcement, emergency medical services, safety organizations, industry partners, and academia. The traffic records community and general public also contributed through external forums (Federal Register) and at the 2016 Traffic Records Forum. These are available on a first come, first served basis by emailing Barbara Morgan, NJLTAP registrar.
Automated Speed Enforcement Camera in Work Zones
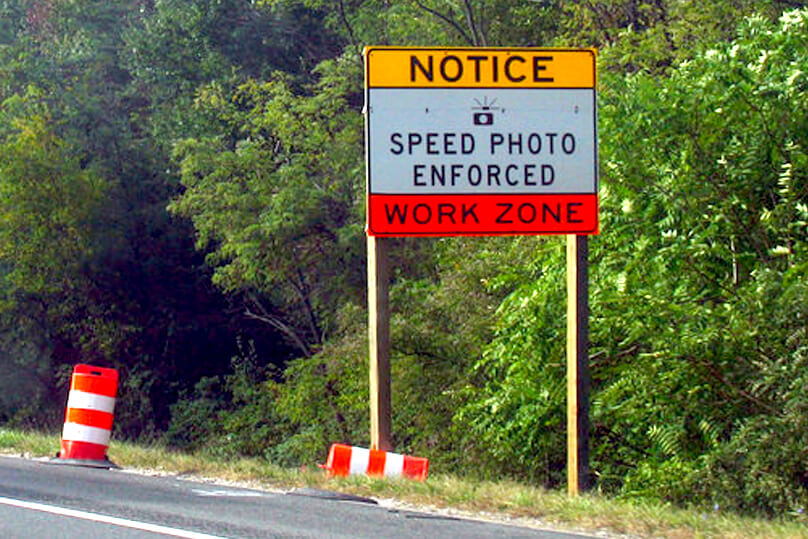
Photo courtesy LandlineMag.com.
If you ask anyone who has ever worked in a work zone environment what their number one safety concern is, they will inevitably say it is the speed by which vehicles pass through their work zone – despite speed reduction and advance warning signs. According to the National Highway Safety Administration, in 2015 alone, 9,557 people lost their lives in speed related crashes (this represents 27% of traffic fatalities that year); about one-third of all crash fatalities in work zones are speed related. On average in New Jersey, over 5,000 crashes occur each year in work zones. In the 2011-2015 time period, 39 people were killed in work zone crashes. The National Transportation Safety Board (NTSB) reported that the current level of emphasis on speeding as a national safety issue is lower than warranted. At present, 17 states and the District of Columbia employ roadside cameras to enforce speeding violations. Although controversial, automated speed enforcement (ASE) is widely acknowledged as an effective countermeasure to deter speeding and curb crashes.
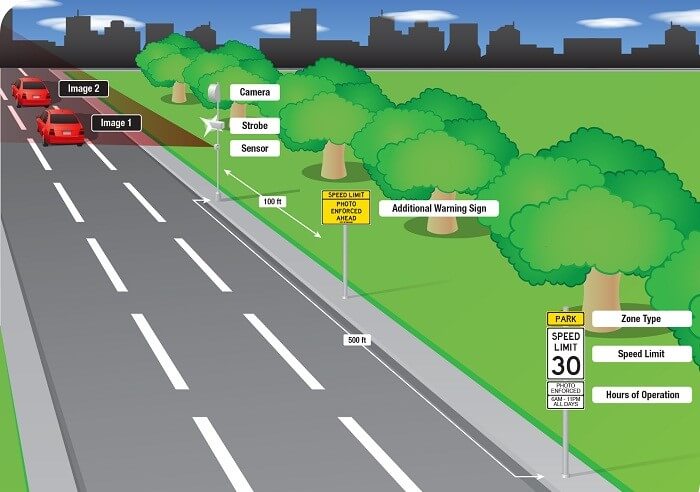
Diagram showing signage and equipment placement for a speed-camera enforced work zone. Image: FHWA.
The Manual of Uniform Traffic Control Devices (MUTCD), which outlines the minimum standards for setting up a safe work zone in Section 6D.03. “Worker Safety Considerations” Part C “Speed Reduction,” essentially states that law enforcement “should be considered” but are not mandatory in addressing the speed issue in work zones. Furthermore, when law enforcement officers are present in work zones, but leave to enforce speeding violations, the work zone becomes vulnerable in their absence. This is because they are no longer providing the traffic calming effect that occurs when the police vehicle is stationary in the work zone with the emergency lights activated. Moreover, finding a safe location to pull a violator over can be challenging in a work zone, not to mention the inherent dangers associated with effectuating a motor vehicle stop.
Currently, Illinois, Maryland and Oregon operate ASE in work zones. Illinois was the first state to implement the program in 2006, followed by Oregon in 2007, and Maryland in 2009. The State of Pennsylvania is now contemplating a 5-year work zone speed camera pilot program. Pennsylvania’s Transportation Advisory Committee (TAC) published a comprehensive report prior to the introduction of the current legislation that outlined work zone safety concerns in their state as well as the ASE programs in the three current states using this type of technology in work zones. Below are details from the final report:
| Program Element | Illinois | Oregon | Maryland |
|---|---|---|---|
| Authorizing Agency | State Police/DOT | DOT | DOT |
| Warning signs in Work Zone | Yes | Yes | Yes |
| Violator responsibility | Driver | Vehicle owner | Vehicle owner |
| What is photographed? | Driver and rear of vehicle/license | Driver and rear of vehicle/license | Rear of vehicle |
| Speed display | Yes | Yes | Yes |
| Police officer in ASE vehicle? | No | Yes | No |
| Violation issued at | Generally, over 6 mph | 11 mph over posted limit | 12 mph over posted limit |
| Citation cost/Points | $375; $1000 for second violation & suspension | Varies from $220 and $870 depending on speed | $40, no points |
| Operational hours | When workers are present | When workers are present | Anytime |
| Who receives citation revenue? | Illinois State Police | State criminal fine acct/local police and court | Maryland State Police and Transportation Trust Fund |
| Vendor payment | Flat fee/vehicle/month | Varies | Flat fee/vehicle |
| Safety results | Reduced mean speed varied | Reduced mean speed 10.5 | 10% reduction of total crashes in work zones; 50% decline in injury crashes on interstates; 46% decline in numbers of citations issued. |
The findings and recommendations of the comprehensive Pennsylvania TAC report noted that while Work Zone Safety Performance has shown some improvement, it has not been as much as overall highway safety trends. There remains a need to reduce speeds in work zones, and work zone cameras have proven an effective means of reducing speeds, crashes, injuries and fatalities. Using an incremental approach that are supported by warning signs and a speed display, work zone cameras can prove an effective means of improving safety.
According to WorkZoneSafety.org, an examination of the Illinois and Maryland programs shows both states recorded reductions in speed, accidents, and fatalities within work zones where ASE was activated. A study conducted in Minnesota found that there is a perception among journalists and policymakers that ASE is unpopular with the general public. Some of the criticisms are that photo enforcement is more about revenue generation than safety, invasion of privacy, and drivers disliking not receiving in-person contact.
Despite the objections, national opinion surveys have generally shown a majority of Americans support ASE. Moreover, when ASE is limited to certain types of locations, such as work zones and schools, and a clear link to public safety is established, public support rises. In one opinion survey in Minnesota, 83% supported that type of automated enforcement. In New Jersey, a bill was introduced, NJ A5082(16R), in July of this year for the creation of a five-year pilot program to allow ASE in construction zones. The legislation pushes for active work zones to be monitored, with a violation cost set at $100 and revenue being distributed towards public education.
As technology continues to integrate itself into daily routine, careful consideration must be given to both the positive and negative impacts resulting from such advancements. There is no question that speed kills – and reducing speed anywhere on the roadway, particularly in school and work zones, is a step in the right direction. The question remains as to what the best countermeasures are to do so.
Low-Cost Safety Enhancements for Stop-Controlled Intersections
On a nationwide scale, according to the Federal Highway Administration (FHWA), more than 21 percent of all fatalities, 52 percent of injuries, and 45 percent of property damage crashes occur at or near intersections. Compared to the signalized intersections, stop-controlled intersections experience more fatal crashes, due to their being mostly right-angle collisions.
To be specific, two-thirds of crashes occur at stop-controlled intersections include right-angle collisions, involving a vehicle entering the intersection from the stop approach and a vehicle on the through approach. Although many vehicles are coming from the stop approach stop or at least reduce their speed to 10 miles per hour before pulling out, most of the crash-involved drivers make poor decisions concerning selection of safe gaps between vehicles on the through approach. Risky driving, such as distracted driving, speeding, drowsy driving, and geometric design of intersections contribute significantly to this crash type.
To achieve the Strategic Highway Safety Plans (SHSP) vision, many intersection safety strategies have been recently implemented by state departments of transportation (DOTs) and local agencies to reduce intersection-related crashes. Not only are most of these strategies low-cost countermeasures but they can also be implemented systematically to significantly decrease numbers of statewide crashes and fatalities. The low-cost safety strategies at stop-controlled intersections are designed to enhance drivers’ performance and alertness to the presence of the intersection and mitigate potential conflicts with other entering vehicles.
| Basic Countermeasures | Supplemental Countermeasures | |
|---|---|---|
| Through approach | Stop Approach | |
| • Doubled up (left and right), oversize advance intersection warning signs with street name sign plaques | • Doubled up (left and right), oversize advance “Stop Ahead” intersection warning signs • Doubled up (left and right), oversize “STOP” signs • Installation of a minimum 6-foot-wide raised splitter island on the stop approach (if no pavement widening is required • Properly placed stop bar • Removal of any foliage or parking that limited sight distance • Double arrow warning sign at stem of T-intersections |
• Installation of a minimum 6-foot-wide raised splitter island on stop approach that requires pavement widening • Either, a) flashing solar-powered LED beacons or advance intersection warning signs and “STOP” signs, or b) flashing overhead intersection beacons • Dynamic warning sign to advise through traffic that a stopped vehicle is present and may enter the intersection • Transverse rumble strips across stop approach in rural areas where noise is not a concern and running “STOP” signs is a problem (use “Stop Ahead” pavement markings if noise is a concern) • Extension of the through edge-line using short skip pattern may help drivers stop at an optimal point • Reflective stripes on sign posts may be used on signs with degraded visibility due to sign clutter or competing background features to increase attention to the sign, particularly during nighttime conditions |
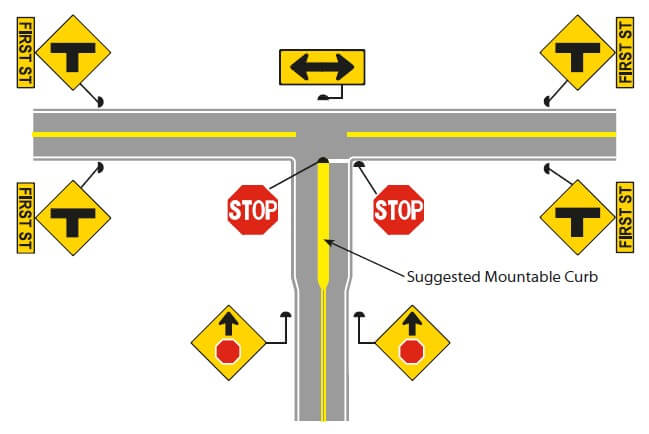
Figure 1. Basic Countermeasures for Stop-Controlled Intersections
These safety countermeasures, which are typically divided into two major categories of basic and supplemental, can be implemented at stop-controlled intersections with single or multiple undivided through lanes. Basic countermeasures typically are very low-cost and efficient strategies to mitigate the future crash potential. It is suggested that these countermeasures be implemented at all intersections exceeding a defined urban and rural crash threshold. On the other hand, additional supplemental countermeasures are those that are commonly used at intersections with crash levels significantly higher than the crash threshold or the intersections that experience specific crash types that the countermeasure can address. Table 1 lists the entire set of basic and supplement safety countermeasures for stop-controlled intersections. Figure 1 also depicts examples of basic safety countermeasures for stop-controlled intersections.
According to the FHWA Toolbox of Countermeasures and Their Potential Effectiveness to Make Intersections Safer and other FHWA publications, a basic set of signs and marking improvements can reduce crashes up to 40 percent. Installation of a minimum 6 ft. wide raised splitter island on stop approach decrease crashes by 15 percent. In addition, flashing solar-powered LED beacons on advance intersection warning signs and STOP signs, and flashing overhead intersection beacons can reduce crashes by 10 percent. Furthermore, transverse rumble strips across the stop approach lanes in rural areas decrease crashes by 28 percent. Dynamic warning sign system can also reduce the overall crashes and severe angle crashes by 51 percent and 77 percent, respectively.
Staying Fit for Snow Fighting
With winter weather comes snow fighting and with snow fighting comes fatigue. Unpredictable weather can lead to long difficult hours on the road with few breaks and little sleep. However, there are several things agencies and drivers can do to make sure crews are in good shape to combat Old Man Winter, maintain our roads, and get home safely.
Why does fatigue happen?
Unpredictable weather leads to varying work schedules which can throw your circadian rhythm out of balance. Your circadian rhythm (also known as your sleep/wake cycle or body clock) is a natural, internal system that is designed to regulate feelings of sleepiness and wakefulness over a 24-hour period. When we make changes to our sleep patterns, it throws our rhythm out of balance and causes fatigue; confusing our body on when it should be sleeping and when it should be awake.
What happens to our bodies when we are fatigued?
When our bodies are fatigued, the following symptoms result:
- Increased reaction time – takes longer to act when a threat is noticed
- Decreased alertness – takes longer to notice a threat
- Reduced situational awareness – lesser ability to notice what is happening around you
- Poor assessment of risk – decision making is more difficult
- Impaired memory – can be difficult to remember details
- Reduced field of vision – peripheral vision is reduced and tunnel vision can result
- Difficulty in staying awake – eye lids get “heavy” and eyes can shut for longer periods of time
- Get some rest – try to optimize your sleeping conditions
- Eat well – feed your body properly and stay awake longer
- Exercise
Courtesy of the Connecticut Technology Transfer Center
USDOT Announces New Automated Driving Systems Guidance
![]() On September 12, 2017, the U.S. Department of and National Highway Traffic Safety Administration released new federal guidance for Automated Driving Systems (ADS): A Vision for Safety 2.0. This is the most current guidance for automated driving systems to industry and States. The document is available to view at NHTSA Automated Vehicles for Safety website.
On September 12, 2017, the U.S. Department of and National Highway Traffic Safety Administration released new federal guidance for Automated Driving Systems (ADS): A Vision for Safety 2.0. This is the most current guidance for automated driving systems to industry and States. The document is available to view at NHTSA Automated Vehicles for Safety website.
This new voluntary guidance focuses on the SAE International Levels of Automation for Conditional, High, and Full Automation; clarifies the guidance process and that entities do not need to wait to deploy ADS; revised unnecessary design elements from the safety self-assessment; aligns federal guidance with up to date developments and industry terminology; and, clarifies Federal and State roles moving forward.
OSHA Updates, Centralizes Silica Standards Online
![]() Information on silica hazards and related OSHA standards are now in one location on OSHA’s website. The updated silica page contains links to guidance on complying with OSHA’s silica standards in both construction and general industry and maritime, as well as information on silica sampling and analysis, health effects of silica exposure, and answers to frequently asked questions.
Information on silica hazards and related OSHA standards are now in one location on OSHA’s website. The updated silica page contains links to guidance on complying with OSHA’s silica standards in both construction and general industry and maritime, as well as information on silica sampling and analysis, health effects of silica exposure, and answers to frequently asked questions.
From the FHWA Office of Safety: Safety PM
Safety Performance Management (Safety PM) is part of the Transportation Performance Management (TPM) program, which FHWA defines as a strategic approach that uses system information to make investment and policy decision to achieve national performance goals. The Safety PM Final Rule supports the Highway Safety Improvement Program (HSIP), as it establishes safety performance measure requirements for the purpose of carrying out the HSIP and to assess fatalities and serious injuries on all public roads. New resources are available at https://safety.fhwa.dot.gov/hsip/spm/.

Meet the Instructor: Patricia Ott
What motivated you to get involved in civil engineering in general, and transportation in particular?
My father was biggest influence growing up, and my biggest supporter in getting me involved in engineering. Growing up I was a tomboy, and I loved to build things with my father. I always had an aptitude for math and science, and I had a talent for mechanical drawing. Once I arrived at Rutgers University, one of the first courses I took exposed you to all the different types of engineering so that you could pick a path for your next four years. I really took a liking to Civil Engineering; I loved the lab work and working with concrete. I went to the construction side of things because at the time, there really was no distinct transportation field.
Were there any other female engineers with you in the program? It seems to be a rare major for young girls, especially at the time.
The ladies’ room was never crowded. There were only four of us. And I chose an even rarer combination of doing a five year double major of Civil Engineering and Psychology.
That’s a fascinating combination; why did you choose psychology? Is that something that you feel has helped you as an engineer?
I had a passion for people, and understanding people and how they think from a cognitive standpoint. And I do feel like it helped me immensely in my career. When I was at NJDOT, there were career track that you could be on; you were either going to be an expert engineer, or you were going to be a manager. Thanks to my aptitude in psychology, I was able to supervise people very well and I eventually made director. I think being both an engineer and a manager of people are key abilities to have if you want to advance in your career.
Why did you choose to work at NJDOT?
Because they were hiring. The job market at the time was poor, and I remember interviewing thinking this was the best chance I had to get involved with building, design, and materials…things I was very passionate about. It was after being at NJDOT for a few years that one day the New Jersey Institute of Technology announced that they were starting a pilot program for a Masters in Transportation. They approached NJDOT about holding the program with a dozen of us from NJDOT, and that’s where transportation really became more prominent in my career.
How did working for NJDOT help you shape your career?
I’d say the most important aspect for working for NJDOT was that it allowed me to become a truly well rounded Engineer. Whether it was design, safety, construction, materials…I even spent a year working with the budget director which helped learn more about finances and allowed me to become a better engineer, and a better director.
Would you say you have a career accomplishment that you are proudest of at NJDOT?
I can tell you one of things I’m most proud of; I was voted on by my staff for the department’s diversity award, for having the most diverse staff. It made me feel extremely proud to have my department be recognized for all the different people we had brought in of all different backgrounds. Also, being able to look back now at all the people who I was able to bring in that have gone on to have successful careers at NJDOT themselves. It’s extremely rewarding. And in that vein, I would say the thing I miss the most about NJDOT is the people that I worked with.
How does it compare to having your own firm?
Both are wonderful, but going back to my father’s influence, he always told me to try and work for yourself if you can. I got to the point where I was able to retire and start my own business and I took it. It’s great because now I can focus in on the things I really care about. I get to focus on traffic, safety, and saving people’s lives.
In regards to the next generation of engineers that you are helping to train, there are concentrated efforts to get more women involved in STEM careers. What kinds of barriers do you think exists to getting more women involved?
Well I think there is still a stigma that exists for young women. I have never considered myself to be a female engineer; just an engineer. There is no gender associated with it. But still, the lack of role models that exist in the field helps contribute to the perception I think leads many young people away from the field.
What advice do you have for young women today who are interested in starting a career in engineering?
Well you have to start early. In the safety world, we try to reach out to kindergartners to help develop a safety culture. Similarly, young people need to be reached in that K-12 timeframe if you want to instill a passion for STEM careers. Then they can carry it with them throughout the rest of their school days. The good thing is, there seems to be more opportunities today and more flexibility for students. The potential is out there, we just need to do a better job of inspiring them and educating them as to what a career in engineering actually entails.
Thanks so much for speaking with us today Mrs. Ott, we appreciate you taking the time.
Early Action Steps in Groundbreaking at Portal North Bridge as Gateway Program Gets Underway
The first step toward the long-anticipated Gateway Program broke ground on Friday, October 13th with the beginning stages of the Portal North Bridge in South Kearny. The groundbreaking represents nearly $20 million worth of improvements that will work to improve the bridge’s reliability as it is a crucial piece to rail transportation between New Jersey and New York. While these pre-construction actions are early action steps, the total replacement of the bridge is estimated to cost $1.5 billion.
The Portal North Bridge was built in 1907 over the Hackensack River in Kearny and Secaucus as a moveable swing-span bring with two tracks that serves North East Corridor rail service and opens for marine traffic. However, the century old structure has a history of malfunctioning and causing delays when opening for barges – a bottleneck effect to rail traffic that negatively impacts the nearly 500 trains with over 150,000 passengers that travel on it daily. The pre-construction improvements under this first phase include the construction of a finger pier to help workers gain access to the site, movement and upgrade of utility infrastructure, the construction a steel bridge structure over the Jersey City Municipal Utility Authority water main, and the construction a retaining wall. While the structure is still functional, future replacement of the bridge will lift it to almost double its clearance over the Hackensack River to a height of 53 feet above mean high water, which would both eliminate any delays caused by marine traffic and also would permit higher rail speeds.
Though the Portal North Bridge was once owned by Amtrak, the federal government now owns the span that is used by both NJ Transit and Amtrak. The engineering and design of the bridge has been completed through a partnership involving Amtrak, NJ Transit, Port Authority of New York and New Jersey, and U.S. Department of Transportation since 2013 when a Record-of-Decision was received from the Federal Railroad Administration. More recently, the Federal Transit Administration adopted this Record-of-Decision in August 2017. The $20 million pre-construction improvements to the Portal North Bridge are funded through a $16 million grant from the Transportation Investment Generating Economic Recovery (TIGER) discretionary grant program, which received $4 million in match funding from the New Jersey Transportation Trust Fund.
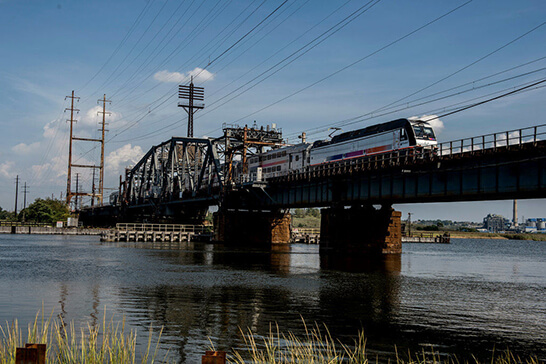
NJ Transit train crossing the Portal Bridge. Photo: Adam Elmquist, Bridgehunter.com #257886
The entire project is currently estimated to cost $1.5 billion and includes supplement financial commitments by the local partners, including $284 million by the Port Authority of New York & New Jersey and approximately $300 million from the State of New Jersey and NJ Transit. The additional funding required for the full build-out relies largely on the FTA’s Capital Investment Grant (CIG) project development pipeline and seeks nearly $750 million of the estimated $1.5 billion project cost through this funding opportunity. While initial agreement that fit this structure was drafted under former President of Barack Obama and set up a federal commitment to cover roughly half the bill, with the local partners picking up the balance, the new administration has not fully committed to the project. More recently Federal involvement has become a bit clearer, with the House of Representatives passing spending bill to set aside up to $900 million for Gateway.
In addition to the Portal North Bridge improvements, the Gateway Program likewise envisions a similar “Portal South Bridge” that will have two tracks in order to help support an anticipated doubling of rail capacity between Newark and New York. The Gateway Program proposes future phases that include additional capacity at Penn Station, “Bergen Loop” connection at Secaucus Junction to offer more North Jersey commuters a one-seat trip to New York, a new tunnel into New York, and future Hudson Tunnel rehab and repairs in order to double capacity. With approximately 10% of the nation’s GDP relying on this infrastructure, the Gateway Program as a whole remains a crucial component to bringing old infrastructure up to speed and insuring that it can both perform as well as handle additional capacity and growth.
Safe Transportation for Every Pedestrian (STEP) EDC4 highlights
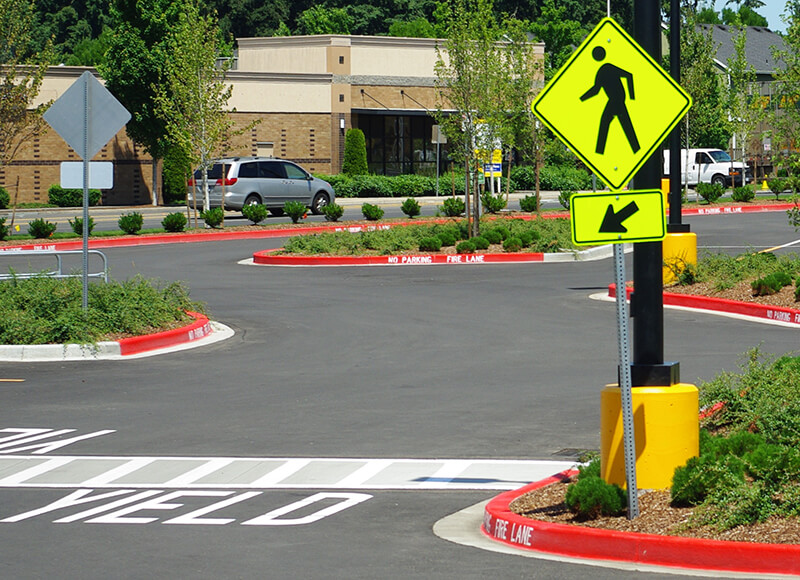
Knowing how to determine good locations and which countermeasures to use in a given situation enables transportation agencies and other organizations increase pedestrian safety. Photo: Wikimedia
Pedestrians account for over 17.5 percent of all fatalities in motor vehicle traffic crashes, and the majority of these deaths occur at uncontrolled crossing locations such as mid-block or un-signalized intersections. These are among the most common locations for pedestrian fatalities generally because of inadequate pedestrian crossing facilities and insufficient or inconvenient crossing opportunities, all of which create barriers to safe, convenient, and complete pedestrian networks. By focusing on uncontrolled locations, agencies can address a significant national safety problem and improve quality of life for pedestrians of all ages and abilities.
Pedestrian Safety Countermeasures
FHWA is promoting the following pedestrian safety countermeasures through the fourth round of Every Day Counts (EDC-4):
Road Diets can reduce vehicle speeds and the number of lanes pedestrians cross, and they can create space to add new pedestrian facilities.
Pedestrian hybrid beacons (PHBs) are a beneficial intermediate option between RRFBs and a full pedestrian signal. They provide positive stop control in areas without the high pedestrian traffic volumes that typically warrant signal installation.
Pedestrian refuge islands allow pedestrians a safe place to stop at the midpoint of the roadway before crossing the remaining distance. This is particularly helpful for older pedestrians or others with limited mobility.
Raised crosswalks can reduce vehicle speeds.
Crosswalk visibility enhancements, such as crosswalk lighting and enhanced signing and marking, help drivers detect pedestrians—particularly at night.

Crosswalk overhead beacon and signage in Tucson, AZ. Photo: FHWA.
Benefits
- Improved Safety. Countermeasures are available that offer proven solutions for reducing pedestrian fatalities at uncontrolled crossing locations.
- Targeted Investment. By focusing on uncontrolled locations, agencies can address a significant national pedestrian safety problem.
- Enhanced Quality of Life. Improving crossing opportunities boosts quality of life for pedestrians of all ages and abilities.
Road Diets, pedestrian refuge islands, and PHBs are all considered Proven Safety Countermeasures by the Federal Highway Administration (FHWA). The FHWA is also promoting Road Diets through EDC-3. Communities benefitting from their use include Austin, Texas, where at least 39 PHBs are already installed and residents can request additional sites for them. In Michigan, the Department of Transportation (DOT) developed a Road Diets checklist to ensure smooth administrative procedures.
This EDC-4 effort will help more communities deploy these pedestrian safety improvements based on their specific roadway contexts and needs. It also aligns with USDOT’s Safer People, Safer Streets initiative and with other USDOT efforts such as Ladders of Opportunity, which aims to provide people with safe, reliable and affordable connections to employment, education, healthcare and other essential services.
STEP is also an important action in FHWA’s Strategic Agenda for Pedestrian and Bicycle Transportation, which is a collaborative framework for pedestrian and bicycle planning, design, and research efforts being developed over the next five years.
FHWA Launches the Strategic Highway Safety Plan Database
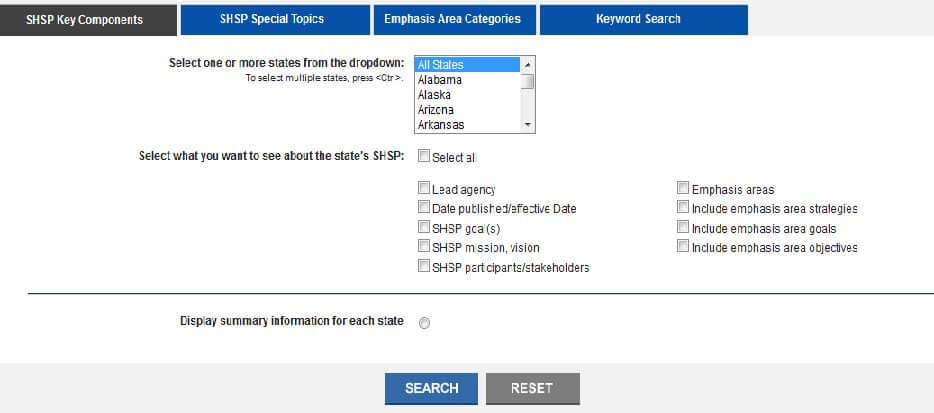 The Strategic Highway Safety Plan (SHSP) Database provides a wealth of information about the data-driven approaches States are using to reduce roadway fatalities and serious injuries. The database compiles key data from each state’s SHSP in one easy-to-use database. Since most of our work relates to the SHSP, the database is a quick reference resource that can help inform our programs. States may also find this database to be a useful tool in updating their SHSPs.
The database includes information about emphasis area strategies and action plans; safety partners within the 4E’s (engineering, education, enforcement, and emergency medical services); approaches States are using to update, implement, and evaluate plans; and much more. Users can search the database by Key Components (e.g., vision and mission statement, emphasis area, and lead agency); Special Topics (e.g., emphasis area action plans and local and rural roads); Emphasis Area Categories (e.g., infrastructure and behavioral); or by using a Keyword Search.
When using the SHSP Database, users should note the following:
- The term “State” includes the District of Columbia and Puerto Rico.
- The database is populated with information from publicly available SHSPs, which are posted by the USDOT and are available through an interactive map on FHWA’s Office of Safety website.
- There is a short interval between when updated SHSPs are available and the time those data appear in the database.
- Some data are subjective and are based on an interpretation of SHSP content. For example, emphasis area strategies are organized by categories established by the developers of the database to make it easier for users to compare data across States.
- The U.S. Government does not endorse products or manufacturers. Trademarks or manufacturers’ names may be mentioned if they are considered essential to the objective of the document.
You can also access the database through the SHSP website or the SHSP Community of Practice website. For more information, please contact Danielle Betkey.
USDOT Announces $500 Million Funding Opportunity via TIGER Program
WASHINGTON – The U.S. Department of Transportation announced on September 7th, 2017 the opportunity for state and local stakeholders to apply for $500 million in discretionary grant funding through the Transportation Investment Generating Economic Recovery (TIGER) program.
“The TIGER grant program is a highly competitive program whose winners will be awarded with the funding they need to rebuild the infrastructure of their communities,” said Secretary Elaine L. Chao. “TIGER grants will continue to fund innovative projects that will improve the safety of America’s passengers and goods.”
![]()
The Consolidated Appropriations Act, 2017 appropriated $500 million, available through September 30, 2020, for National Infrastructure Investments otherwise known as TIGER grants. As with previous rounds of TIGER, funds for the fiscal year (FY) 2017 TIGER grants program are to be awarded on a competitive basis for projects that will have a significant impact on the Nation, a metropolitan area, or a region. The FY 2017 Appropriations Act specifies that TIGER Discretionary Grants may not be less than $5 million and not greater than $25 million, except that for projects located in rural areas the minimum TIGER Discretionary Grant size is $1 million.
The selection criteria remain fundamentally the same as previous rounds of the TIGER grants program, but the description of each criterion was updated. Additionally, the FY 2017 TIGER program will give special consideration to projects which emphasize improved access to reliable, safe, and affordable transportation for communities in rural areas, such as projects that improve infrastructure condition, address public health and safety, promote regional connectivity, or facilitate economic growth or competitiveness.
To provide technical assistance to a broad array of stakeholders, USDOT is hosting a series of webinars during the FY 2017 TIGER grant application process. To view the FY 2017 TIGER webinars and materials, please visit the TIGER Webinar Series webpage. The deadline to submit an application for the FY 2017 TIGER grant program was Monday, October 16, 2017 and awards are not anticipated before the New Year.
Since the TIGER grant program was first created, $5.1 billion has been awarded for capital investments in surface transportation infrastructure over eight rounds of competitive grants. Throughout the TIGER program, these grants have supported projects that have a significant impact on the Nation, a metropolitan area, or a region. TIGER grants have historically achieved, on average, co-investment of 3.6 dollars (including other Federal, State, local, private and philanthropic funds) for every TIGER dollar invested.
Did you know…?
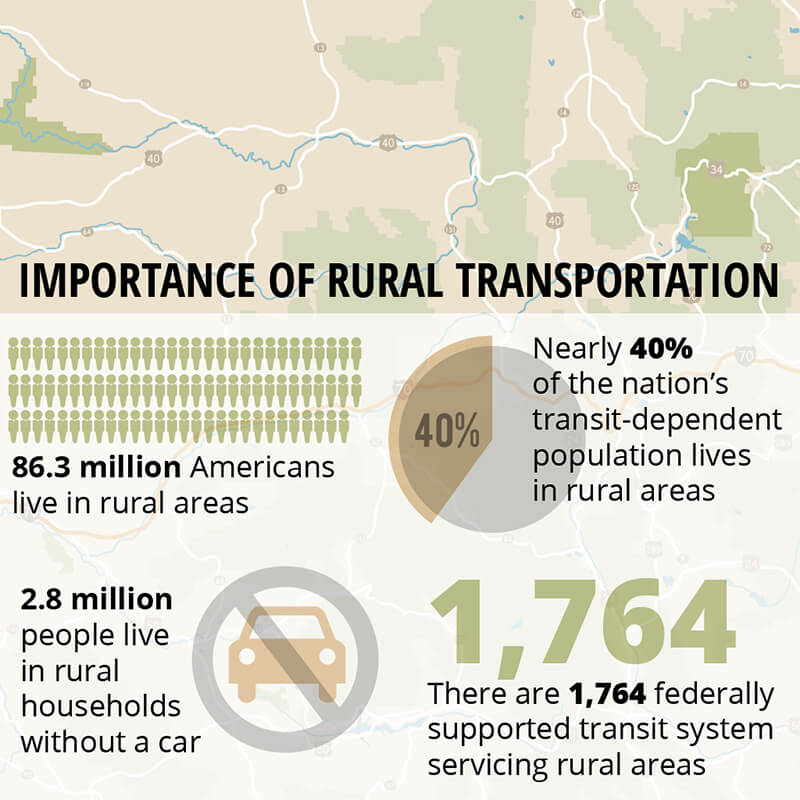 The U.S. Department of Transportation is committed to supporting the 86.3 million Americans living in rural areas. The Department’s INFRA grant program will award at least 25% of funding to rural projects, and will consider rural projects to the greatest extent possible. For rural communities in need of funding for highway and multimodal freight projects with national or regional economic significance, INFRA is an opportunity to apply directly for financial assistance from the federal government. You can find out more at www.transportation.gov/buildamerica/infragrants.
ITS is Changing the World
By Egan Smith
At this moment, the Nation stands at the cusp of some of the most revolutionary changes to its transportation system in decades. Connected and automated vehicles are closer than ever to being part of the everyday world of U.S. roadway users, and decisions made regarding these and other advanced technologies could affect the future of transportation profoundly.
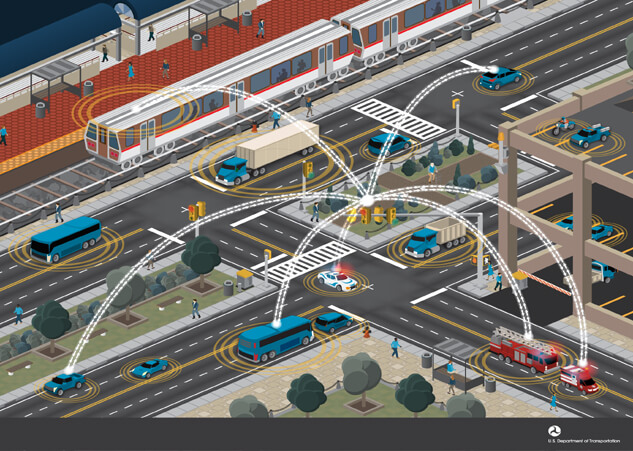
Connected Vehicle Reference Implementation Architecture (CVRIA), which establishes a framework for the integration and standardization of connected vehicle technologies. Image: USDOT.
With the United States moving toward an intelligent and connected transportation system, come along for a few minutes to reflect on the history of the field, recognize lessons learned, identify trends and their historical implications, and acknowledge both the successes and the missteps that have led to this point in the evolution of intelligent transportation systems (ITS). These systems advance transportation safety and mobility and enhance U.S. productivity by integrating advanced communications technologies into transportation infrastructure and vehicles. For a fuller discussion, see the History of Intelligent Transportation Systems, which this article summarizes. The publication was produced by the U.S. Department of Transportation’s Intelligent Transportation Systems Joint Program Office.
The benefits of ITS technologies are wide ranging and apply to both urban and rural populations; commuters as well as commercial truck drivers; and pedestrians, bicyclists, and users of public transportation. Building on decades of ITS research and deployments, the very near future will likely include vehicles that can talk to one another and to roadside infrastructure to avoid collisions, reduce congestion, and alleviate environmental impacts. In fact, ITS will enable automated vehicles to interact with the transportation system—a concept that has captured the human imagination for decades and is closer than ever to widespread deployment.
Already, ITS technology has had a significant effect on the current transportation environment. In fact, the Nation is now on the verge of even greater benefits and impacts due to advances in this technology. For example, research on connected vehicles indicates that vehicle-to-vehicle (V2V) safety systems may cut up to 80 percent of those collisions that involve no driver impairment. In addition, ITS technology is a key component of the movement toward connected and smart communities. Smart communities incorporate connected transportation to ensure that data, technologies, and applications—as well as connected travelers—are fully integrated with other systems across a community.
“As research, development, and deployment progress,” says Ken Leonard, director of the USDOT’s Intelligent Transportation Systems Joint Program Office, “these advanced solutions will increasingly yield even more benefits—beyond safety, mobility, and an improved environment—to include overall livability.”
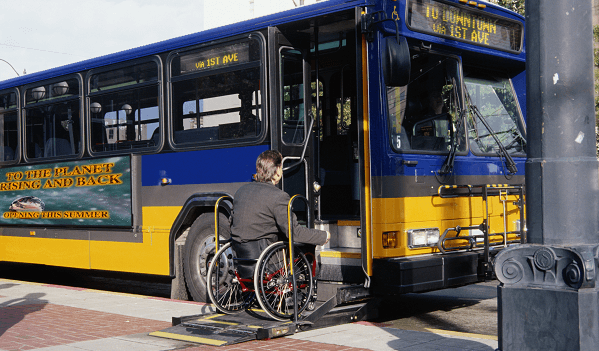
This man is able to access a public bus thanks to the mobility services for All Americans initiative launched by USDOT’s ITS Joint Program Office. Photo: USDOT ITS JPO.
A variety of forces have shaped the present state of ITS technology. The economic downturn in the 2000s focused increased attention on making the most efficient use of the highway system and vehicle fleet. At the same time, communications and information technology evolved at a rapid rate. These factors ultimately led to innovative research initiatives and an explosion of new transportation apps.
Increasingly, ITS applications are considered in two contexts—for automated purposes or for connected vehicle purposes, or both. Automated vehicles are those in which at least some aspect of a safety-critical control function (for example, steering, throttle, or braking) occurs without direct driver input. Automated vehicles may be autonomous (that is, use only vehicle sensors) or may be connected. Connected vehicles use wireless technology to connect vehicle information and location to other vehicles (V2V), to infrastructure (V2I), or to other modes, such as internet clouds, pedestrians, and bicyclists (V2X). The wireless technology typically used for connected vehicles is DSRC, but some functions may use cellular or other types of communications.
In July 2012, the Moving Ahead for Progress in the 21st Century Act (MAP-21) was signed into law. MAP-21 funded surface transportation programs at more than $105 billion for fiscal years 2013 and 2014, and created a performance-based surface transportation program. In addition, MAP-21 continued support for ITS by restoring its research budget to $100 million per year and establishing the Technology and Innovation Deployment Program for $62.5 million per year.
In 2011, USDOT held the first public connected vehicle demonstration at the 18th ITS World Congress in Orlando, FL. This demonstration was followed by the 2012–2013 Connected Vehicle Safety Pilot Model Deployment in Ann Arbor, MI. This real-world test of connected vehicle technology included more than 2,700 participating vehicles using wireless safety technology to help everyday drivers avoid crashes as they traveled along their normal routes. After analyzing data from the pilot program, NHTSA estimated that V2V technology could prevent more than half a million crashes and save more than 1,000 lives each year if implemented across the United States.
In recent years, both privately and publicly funded automated vehicle research and development have been moving swiftly forward. Private companies investing in automation technologies vary greatly in both their background and their approach to automation. In the race to automation, traditional automobile companies are joined by tech giants like Google and Apple and less traditional auto companies like Tesla. Successful integration of these technologies depends on partnerships with multiple stakeholders, including these private companies, as well as research and academic institutions.
The Future
Technology has changed just about every aspect of Americans’ day-to-day lives—including how they do business, keep up with current events, and connect with friends and family. Although billions of devices are now connected to wireless networks, the industry is still just scratching the surface of what is possible. In the future, widespread deployment of connected vehicles will increase traveler safety, while alleviating congestion issues. Partially and fully automated vehicles will become available to the public, further increasing mobility for road users. Furthermore, ITS technology applications, such as traveler information or traffic and demand management, will decrease burdens on roadways.
USDOT seeks to spur adoption of technology and help stakeholders and localities deploy maturing ITS systems. In 2015, USDOT awarded funding to the New York City Department of Transportation, Tampa Hillsborough Expressway Authority, and Wyoming/ICF for pilots of next-generation connected vehicle technology. The three sites have developed comprehensive deployment plans and are going through a design-build-test phase before running an operational environment. The pilots are expected to be operational by the end of 2018.
“The future of ITS will not be a one-size-fits-all solution,” says USDOT’s Leonard. “Transportation systems will need to be interoperable and yet allow local communities to tailor the service and applications capabilities they deploy to solve regional and local issues.”